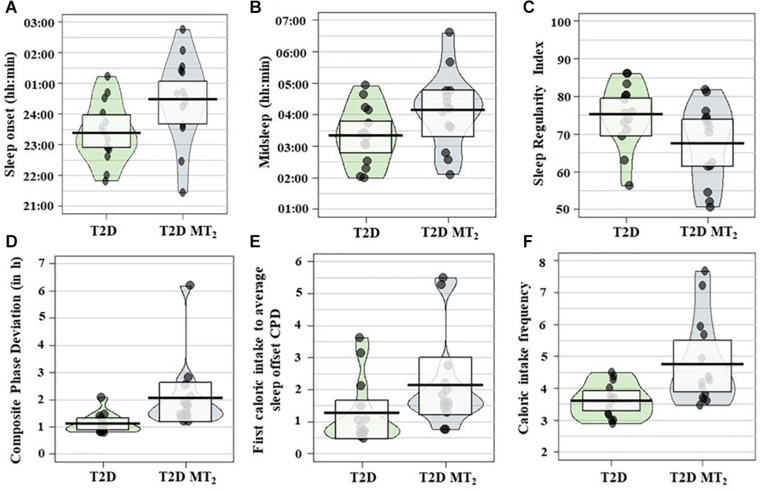
FIGURE 2.
(A) Sleep onset, (B) midsleep, (C) Sleep Regularity Index (SRI), (D) Composite phase deviation (CPD), (E) first caloric intake to average sleep offset CPD; (F) caloric intake frequency; (N = 28) across groups. Pirate plots show median (bar), 25–75th percentile (box) and density of raw data not adjusted for age and sex. T2D controls, Type 2 diabetic control patients; T2D MT2, T2D patients with rare MT2 receptor variants.

