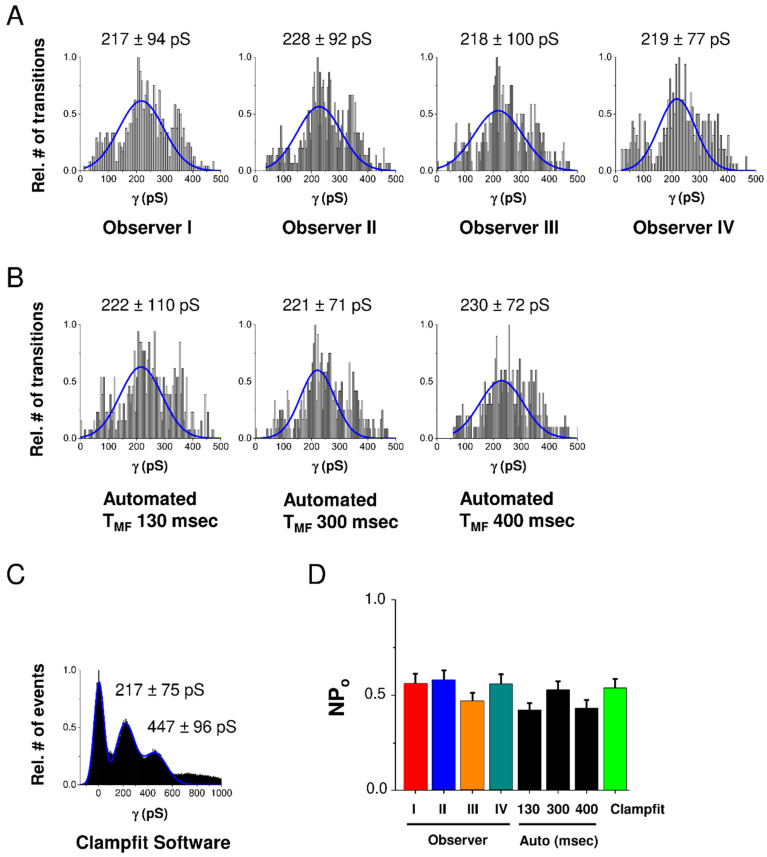
Figure 2.
Validation of HemiGUI analysis by comparing results obtained from user intervention analysis, fully automated analysis and analysis by Clampfit software. Experiments were performed on a dataset consisting of 20 current traces randomly selected from HeLa-Cx43 whole-cell recordings involving voltage steps from −30 mV to +70 mV (N = 3; N = 4; n = 20). (A) All conduction transition histograms were obtained by semi-automated analysis by four independent observers. (B) Automated analysis and the effect of different median filter time window (TMF) sizes. A TMF of 300 ms value based on the slowest transition time observed in the dataset gave a distribution most close to the one observed with semi-automated user intervention-based analysis. (C) All-point histogram generated from baseline-corrected traces generated by Clampfit. (D) Summary graph of nominal open probability (NPo) data demonstrating no statistically significant differences between Clampfit and the two modes of HemiGUI analysis (one-way ANOVA, Bonferroni post-test).

