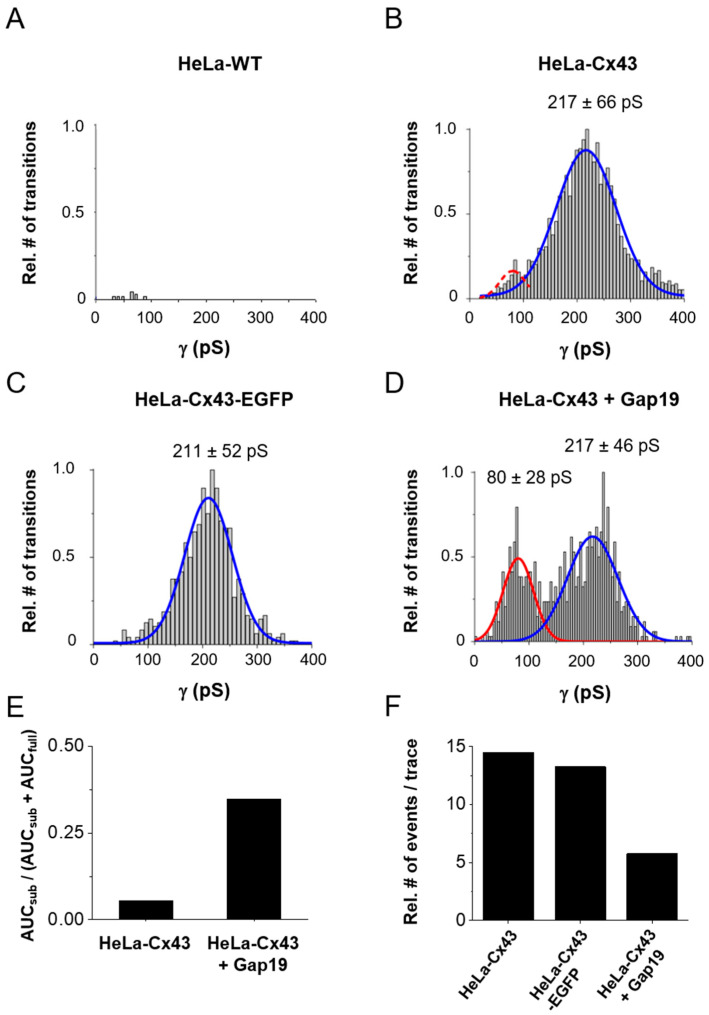
Figure 4.
Distribution of transition conductance and the effect of CT-tagged EGFP and CT-interacting Gap19 peptide. (A) Histogram analysis of transitions expressed as conductance illustrating non-significant event activity in Hela-WT cells (N = 3; N = 9; n = 65, 16 traces per + 40, + 50, and + 60 mV steps and 17 traces per + 70 mV step). (B) HeLa-Cx43 cells showed significant event activity with a unitary conductance of the transitions centered around 217 pS (66 pS SD of the distribution) (N = 4; N = 15; n = 132, 33 traces per Vm step). (C) Transitions were similarly distributed in HeLa-Cx43-EGFP cells with a main peak at 211 pS (N = 3; N = 6; n = 39, 9 traces per + 40 mV step and 10 traces per + 50, + 60, and +70 mV steps). (D) The distribution was completely altered by exposure of HeLa-Cx43 cells to 100 µM Gap19 (N = 3; N = 8; n = 50, 12 traces per + 40 and + 50 mV steps and 13 traces per + 60 and + 70 mV steps), demonstrating a smaller main peak and the appearance of a second peak centered at 80 pS (red curve). The dashed red curve in panel (B) is an event frequency-adjusted scaled version of the 80 pS curve. The number of transitions were normalized to maximum observed in each cluster of the experiment. The main peaks (fully open state) were compared between the different groups by one-way ANOVA and Bonferroni post-test, resulting in no difference in conductance. (E) Ratios of the number of substate transitions (AUCsub) relative to all transitions (AUCfull + AUCsub). (F) All transition event counts expressed per 30 s trace for the different conditions shown.

