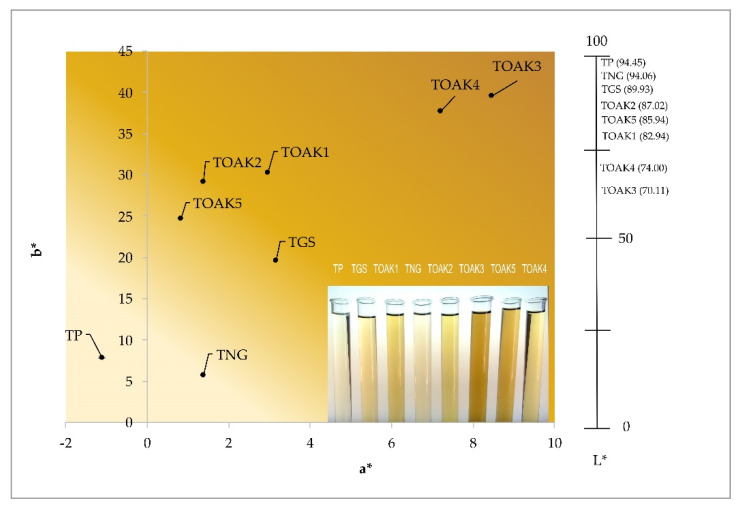
Figure 6.
CIEL*a*b* coordinates of the analyzed tannins dissolved in the model wine solution. The 2D graph in the left reports the a* and b* coordinates, while the 1D axe in the right part reports the L* coordinate. An image of the analyzed tannin solutions is also shown in the bottom-right part of the 2D diagram. TP, Pomegranate tannin; TGS, grape seed tannin; TNG, Nut gall tannin; TOAK1–5, Oak tannin 1–5, respectively.

