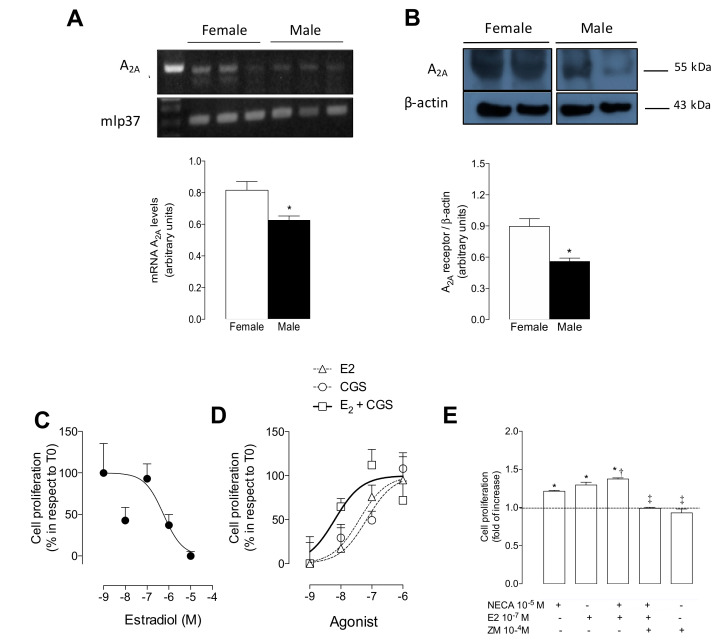
Figure 3.
Expression of A2A and cell proliferation in mPEC derived from female and male wild type mice. (A) PCR analysis of mRNA levels of A2A and housekeeping gene mlp37. Bars below represent densitometry of A2A/mlp37 ratio in female (white bars) and male (black bars) mPEC from wild type (WT) mice. (B) Western blot of A2A (~55 kDa) and β-actin (~43 kDa) proteins. Bars below represent semiquantitative densitometry of A2A/β-actin ratio. Space between blots means that they were run in different gels. (C) Dose–response curve of cell proliferation stimulated by 17β-estradiol (10−9 to 10−5 M, for 24 h) in mPEC isolated from male WT mice. (D) Dose–response curve of cell proliferation stimulated by 17β-estradiol (triangles) or CGS-21680 (circles) or both (squares) in mPEC isolated from female WT mice. (E) Cell proliferation in the presence of NECA (10−5 M, 24 h), with (+) or without (-) 17β-estradiol (10−7 M) or ZM-241385 (10−4 M). In (A) and (B), * p < 0.05 versus respective value in female WT mice. In (E), * p < 0.05 versus basal condition (i.e., without agonist, represented by scatter line) in mPEC isolated from female WT mice. † p < 0.01 versus NECA. ‡ p < 0.0001 versus NECA + 17β-estradiol. Values were expressed as mean ± SEM, n = 5–11 per group. All experiments were performed in duplicate.

