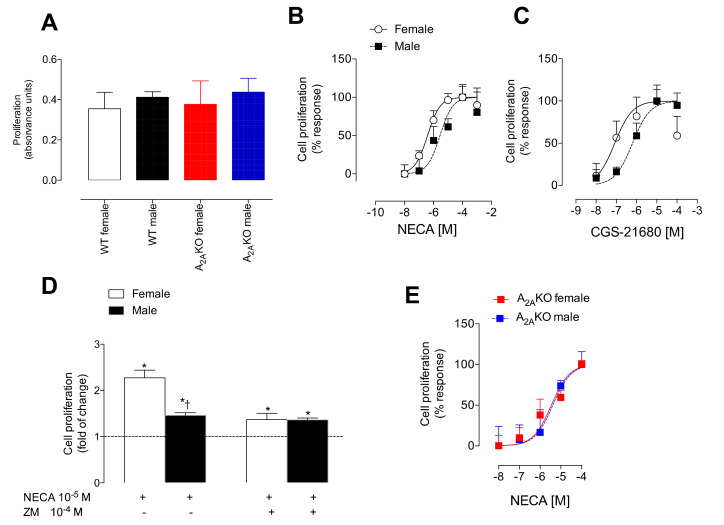
Figure 4.
Sex dimorphism in the A2A-mediated cell proliferation. (A) Cell proliferation measured by bromouridine incorporation at basal conditions in female and male WT and A2AKO mice. Respective groups are identified by different colors. (B) Dose–response curves of cell proliferation induced by NECA or (C) CGS-21680. (D) Cell proliferation in female (white bars) and male (black bars) WT mice with (+) NECA (10−5 M × 24 h) or ZM-241385 (10−4 M × 24 h). The dotted line represents basal values (i.e., control without agonists). (E) Dose–response curves of cell proliferation induced by CGS-21680 in female and male A2AKO. In (D), * p < 0.05 with respect to basal, † p < 0.05 with respect to female WT. Values were expressed as mean ± SEM, n = 4–8 per group in duplicates.

