Figure 5.
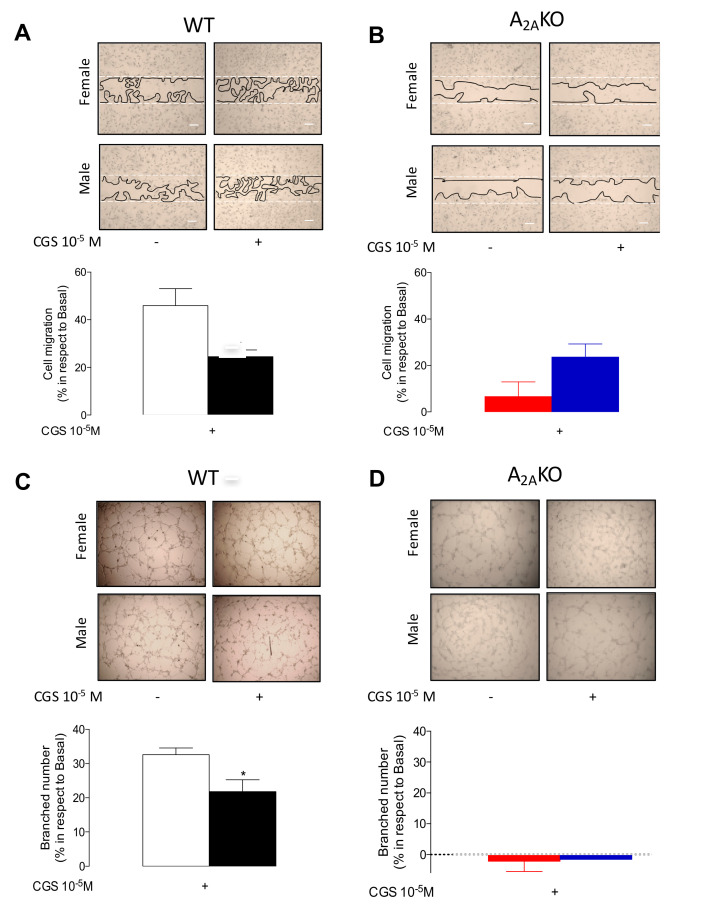
Cell migration and in vitro angiogenesis in mPEC isolated from female and male WT and A2AKO mice. Cell migration was analyzed using the in vitro wound closure assay. (A) Representative images of migration assays in mPEC derived from female and male WT mice. Bars represent the percentage of increase in cell migration in the presence (+) of CGS-21680 (10−5 M × 24 h) in WT female (white bars) and male WT mice (black bars). (B) Representative images of migration assay in mPEC derived from female and male A2AKO mice. Bar represents, as in (A), the response of mPEC isolated from female (red bars) and male (blue bars) A2AKO mice. (C) Representative images and respective quantification of branched number in the in vitro angiogenesis assay (see Methods) in cells treated as in (A) in WT or (D) A2AKO mice. * p < 0.05 vs. female WT. Values are mean ± SEM, n = 4–6 per group in duplicates.

