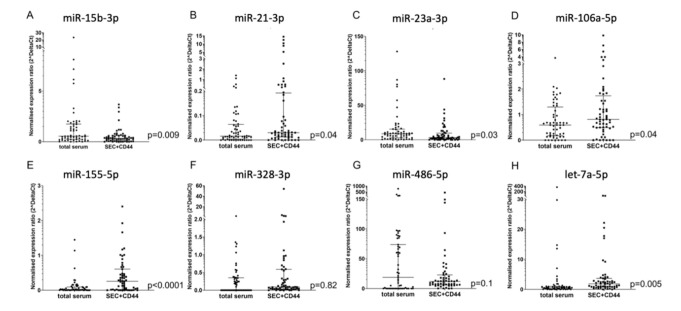
Figure 2.
Comparison of microRNA detection in glioblastoma serum, depending on the source. (A) miR-15b-3p, (B) miR21-3p, (C) miR-23a-3p, (D) miR-106-5p, (E) miR-155-5p, (F) miR-328-3p, (G) miR-486-5p, (H) let-7a-5p. Depicted is the normalized expression ratio (2^deltaCt) of eight microRNAs (A–H) in total serum and in SEC + CD44-purified EVs from the serum of glioblastoma patients (n = 55). Expression levels were compared using a Wilcoxon rank sum test. Note that miR-15b-3p shows higher levels in total serum, as opposed to miR-21-3p and miR-106a-5p, which are upregulated in SEC + CD44 EVs. For miR-328-3p, no consistent up- or downregulation was observed between the two samples, which was partially because only 26/55 (47%) total serum samples were above the limit of detection. Bars depict the median value and the interquartile range.

