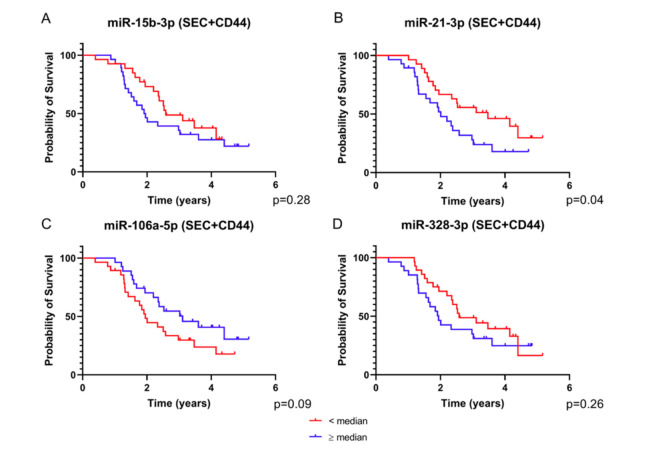
Figure 4.
Survival analysis based on the expression of SEC + CD44 EV microRNA. Depicted are survival curves using a dichotomous assessment based on microRNA levels of SEC + CD44 EVs. ((A) miR-15b-3p, (B) miR-21-3p, (C) miR-106a-5p, (D) miR-328-3p) from glioblastoma patient serum (n = 55). Red color indicates patients with values equal to or higher than the median and blue color represents values lower than the median normalized expression ratio. Note that all four microRNAs were able to stratify the patients into different prognostic subgroups, albeit not reaching statistical significance. The p value for miR-21-3p is above the critical Benjamini–Hochberg value (0.03, Tables S3 and S4). Also note that for miR-106a-5p, higher values correlate with a better prognosis.

