Figure 5.
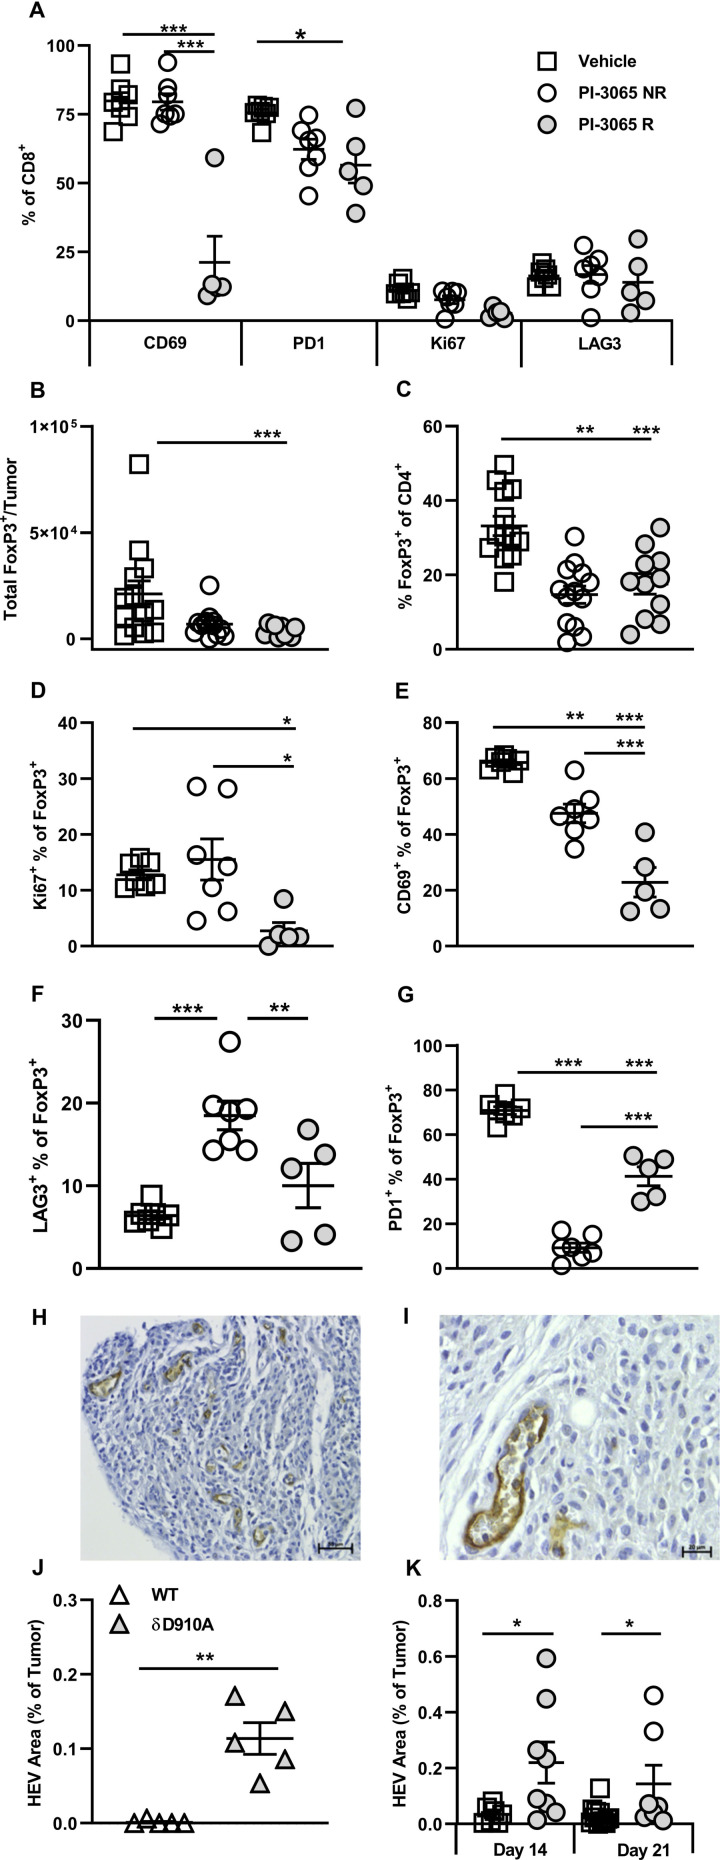
Successful PI3Kδ inhibition in the 4T1 model results in phenotypically distinct CD8+ tumoral T cells and Tregs. (A) Percentage expression of T cell phenotypic markers on CD8+ tumor infiltrating T cells at day 28 post-tumor inoculation. (B) Total number and (C) percentage of FoxP3+ CD4+ T cells and present in tumors at day 28 post-tumor inoculation in the three treatment groups. Percentage of FoxP3+ CD4+ T cells expressing Ki67 (D), CD69 (E), LAG3 (F) and PD1 (G) at day 28 post-tumor inoculation in the three treatment groups. (H and I) Representative high endothelial venules (HEV) staining in 4T1 tumors. (J) Percentage HEV area in tumors from wild-type and PI3Kδ kinase dead mice (δD910A) at day 21 post-tumor inoculation. (K) Percentage HEV area in tumors from mice in the three treatment groups, squares: vehicle treated, shaded circles: PI-3065 treated, open circles: PI-3065 treated regressor. All data are displayed as the mean±SEM, N=5–12 mice/group (NR: non-regressor, R; regressor). Statistical significance was determined by one-way ANOVA (A, C, E, G), Kruskal-Wallis test (B, D) or unpaired T test (J and K). (*p≤0.05, **p≤0.01, ***p≤0.001).

