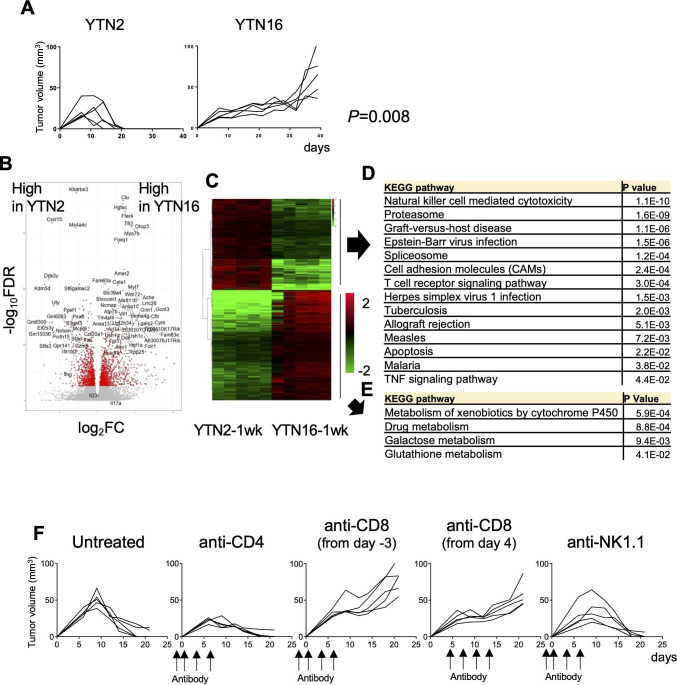
Figure 1.
Tumor growth and transcriptomic analysis of the gastric cancer cell lines YTN2 and YTN16. (A) Mice (n=5) were subcutaneously inoculated with 5×10⁶ YTN2 or YTN16 tumor cells and tumor growth was monitored every 2 or 3 days. P value was calculated by Fisher’s exact test. (B) Tumors (n=5) were harvested on day 7 after tumor inoculation. Total RNA was extracted from tumor tissues and subjected to bulk RNA-Seq. Volcano plot of the relative expression of differentially expressed genes (DEGs) between YTN2 and YTN16 tumors; relative expression (log2FC) and significance (-log10FDR) are shown. Red dots indicate DEGs defined as –log10FDR>5. (C) Heatmap showing expression of DEGs. Kyoto Encyclopedia of Genes and Genomes (KEGG) pathway analyses of DEGs highly expressed in YTN2 (D) and YTN16 (E). (F) Mice (n=5) were subcutaneously inoculated with 5×10⁶ YTN2 tumor cells on day 0. Anti-CD4 and anti-NK1.1 antibodies were injected on days −2, 0, 3 and 6. Anti-CD8 antibody was injected on days −3, 0, 3 and 6 or days 4, 7, 10 and 13. YTN2 tumor growth was monitored every 2 or 3 days.

