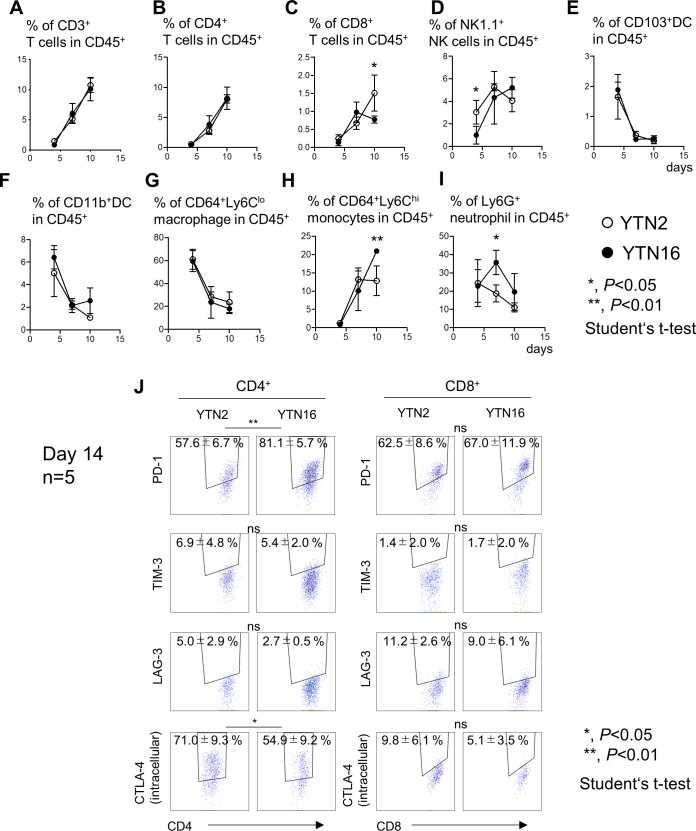
Figure 2.
Tumor-infiltrating cells (TICs) in YTN2 and YTN16 tumors. Mice were subcutaneously inoculated with 5×10⁶ YTN2 or YTN16 tumor cells. Tumor tissues (n=4) were harvested on days 4, 7 and 10; TICs were isolated and analyzed by flow cytometry. Panels show the percentages of CD3+ T cells (A), CD4+ T cells (B), CD8+ T cells (C), NK1.1+ NK cells (D), CD103+ DC (E), CD11b+ DC (F), CD64+Ly6Clo macrophages (G), CD64+Ly6Chi monocytes (H), and Ly6G+ neutrophils (I) in YTN2 tumors (open circles) and YTN16 tumors (filled circles). (J)Expression of PD-1, TIM-3, LAG-3, CTLA-4 in CD4+ and CD8+ T cells from day 14 tumors were shown. Gating strategies were shown in online supplemental figure 1. *p<0.05; **p<0.01, Student’s t-test. CTLA-4, cytotoxic T-lymphocyte-associated protein 4; DC, dendritic cell; LAG-3, Lymphocyte-activation gene 3; NK, natural killer; PD-1, Programmed cell death protein 1; TIM-3, T-cell immunoglobulin and mucin-domaincontaining-3.

