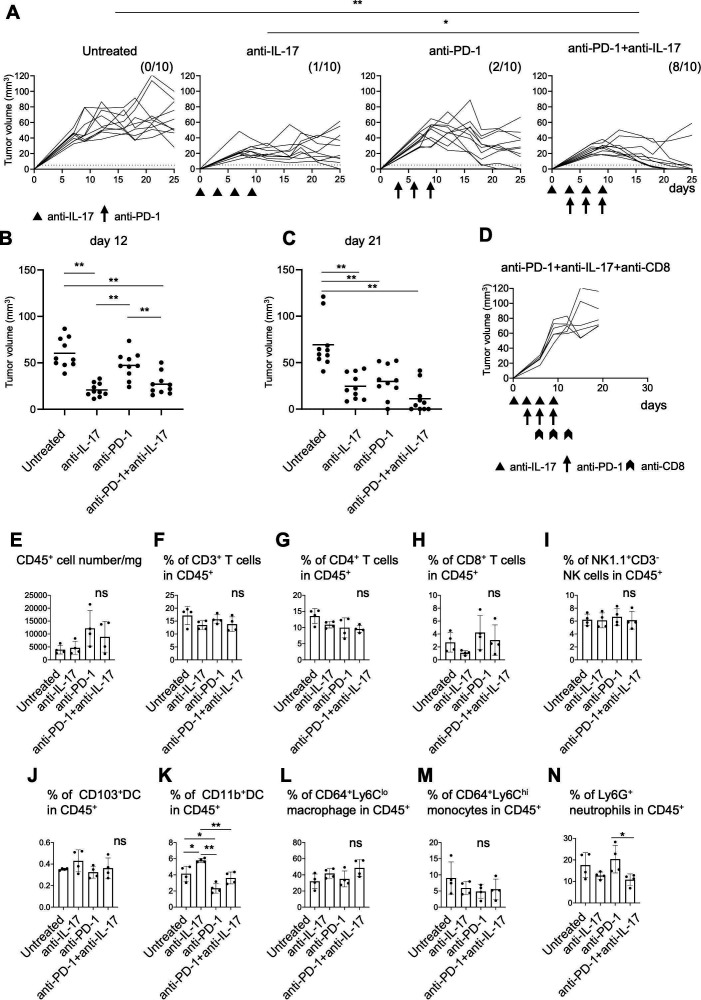
Figure 5.
Combination therapy with anti-interleukin-17 (anti-IL-17) and PD-1 checkpoint blockade. (A) Mice (n=10) were inoculated with 5×10⁶ YTN16 tumor cells on day 0. Anti-IL-17 mAb (200 µg/mouse) and/or anti-programmed cell death protein 1 (PD-1) mAb (200 µg/mouse) were intraperitoneally injected on days 0, 3, 6 and 9 and days 3, 6 and 9, respectively. Tumor volumes were monitored every 2–3 days. The numbers of tumor-free mice on day 25 are shown. *p<0.05; **p<0.01, Fisher’s exact test, p values were adjusted for multiple comparisons according to Hochberg’s method. Tumor volumes on days 12 (B) and 21 (C) are shown. Each dot indicates tumor volume in an individual mouse. (D) Mice (n=5) were subcutaneously inoculated with 5×10⁶ YTN16 tumor cells on day 0 and received anti-IL-17 and anti-PD-1 combination therapy. Anti-CD8 antibody was injected on days 6, 9 and 12 to deplete CD8+ T cells. (E–N) Tumors (n=4) were harvested 10 days after tumor cell inoculation and subjected to flow cytometry. Bar graphs show absolute numbers of CD45+ cells (E), percentages of CD3+ T cells (F), CD4+ T cells (G), CD8+ T cells (H), NK1.1+CD3- NK cells (I), CD103+DC (J), CD11b+DC (K), CD64+Ly6Clo macrophages (L), CD64+Ly6Chi monocytes (M), and Ly6G+ neutrophils (N). *p<0.05; **p<0.01, one-way analysis of variance with Tukey testing for multiple comparisons. PD-1, Programmed cell death protein 1.

