Figure 6.
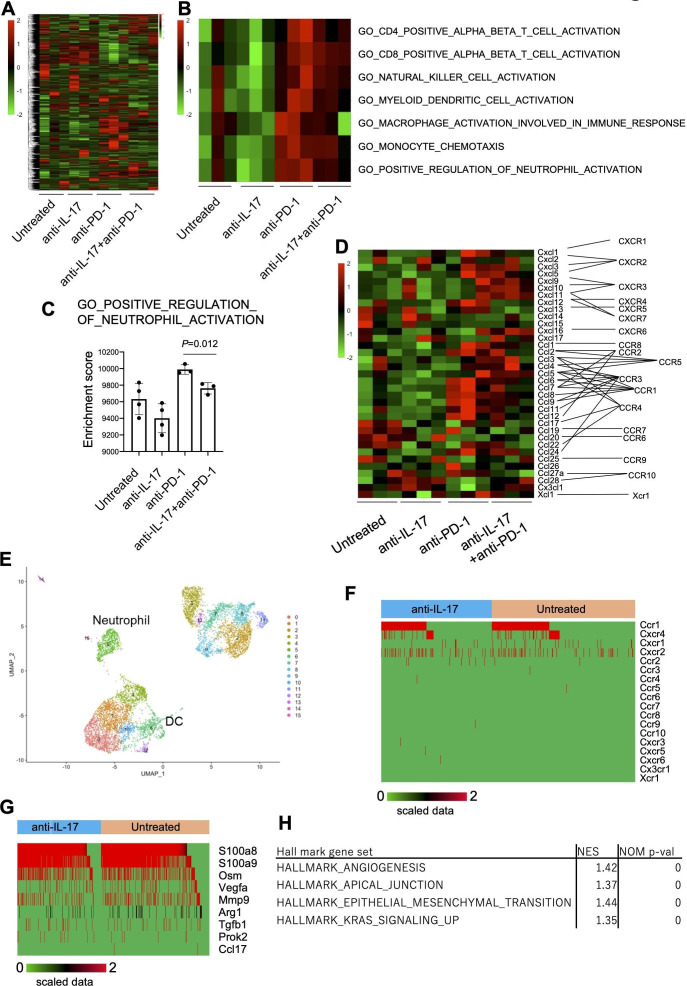
Inhibition of neutrophil infiltration and angiogenesis by interleukin-17 (IL-17) signaling blockade. Mice (n=3) were treated as described in the legend to figure 5. Tumors were harvested 10 days after inoculation and bulk-RNA-Seq was performed. (A) Heatmap of hierarchical clustering analysis of normalized and scaled counts. (B) Heatmap showing scaled ssGSEA enrichment scores. (C) ssGSEA enrichment scores of GO_POSITIVE_REGULATION_OF_NEUTROPHIL_ACTIVATION are shown. (D) The expression of chemokine transcripts in the tumor was shown. (E) CD45+ cells were sorted from untreated or anti-IL-17 mAb-treated day 10 YTN16 tumors and subjected to droplet-based single-cell RNA-Seq (scRNA-Seq). UMAP projections of scRNA-Seq data for CD45+ cells in anti-IL-17 mAb treated and untreated YTN16 tumors (n=8214). The number of cells in each cluster was shown in online supplemental table 10. (F) Chemokine receptor expression in neutrophils (n=636). (G) The expression of functional molecules in neutrophils. (H) GSEA using hallmark gene sets was performed on bulk RNA-Seq data. Gene sets enriched in anti-PD-1 at p<0.05 are shown. DC, dendritic cell. UMAP, Uniform manifold approximation and projection.

