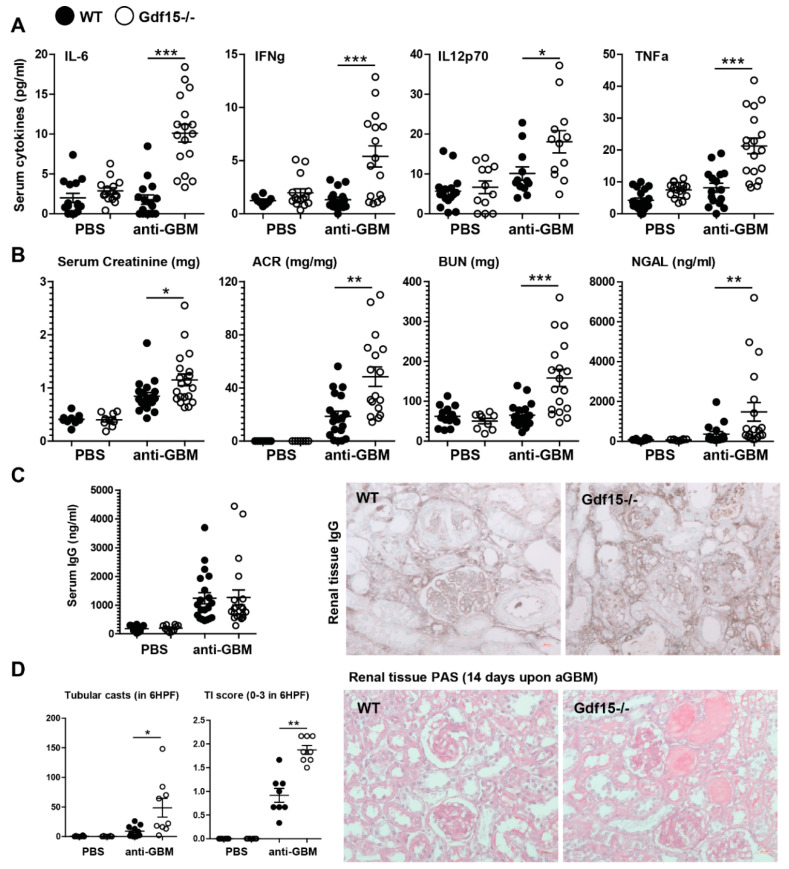
Figure 2.
Systemic inflammation, kidney function, and histopathology of anti-GBM nephritis. (A) Sera were obtained from wild type or GDF15-deficient C57BL/6 mice on day 14 after saline or antiserum (anti-GBM) injection. Cytokine levels were quantified by flow cytometry (n = 15–17, one-way ANOVA). (B) Renal function parameter (n = 15–17, one-way ANOVA). (C) Serum IgG levels (n = 15–17, one-way ANOVA) and immunohistochemistry staining for IgG on kidney sections were quantified. (D) Kidneys from WT or KO mice were paraffin-embedded, stained with Periodic acid-Schiff (PAS) reagent, and quantified to assess tubular casts formation and tubular injury score (n = 8 mice per group, one-way ANOVA). Representative images of renal sections (original magnification 400×). Data are mean ± SEM. * p < 0.05; ** p < 0.01; *** p < 0.001.

