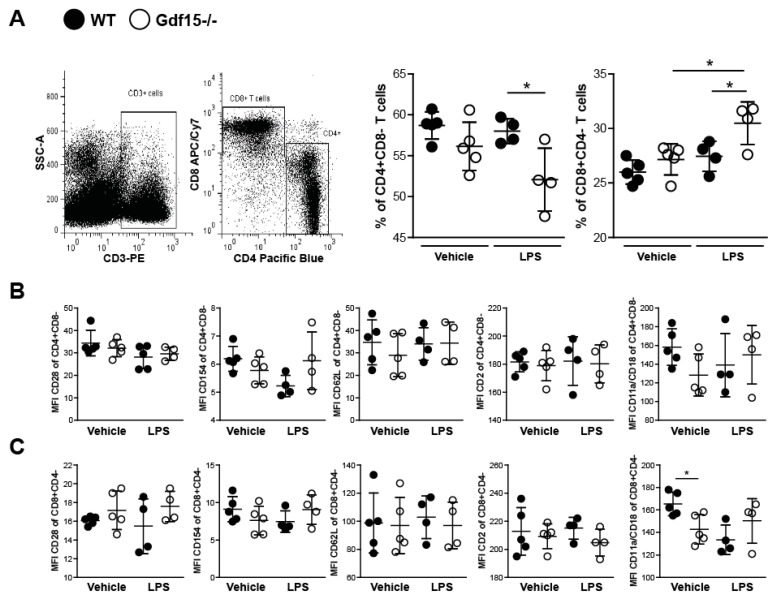
Figure 5.
Stimulation of splenic T cells from WT and Gdf15 KO mice with or without LPS ex vivo. (A) T cells were isolated from WT and Gdf15 KO mice and stimulated with or without LPS for 24 h. The percentage of CD4+CD8- and CD8+CD4- T cells was quantified by flow cytometry (gating strategy, n = 4–5 per group, one-way ANOVA). (B,C) Mean fluorescence intensity (MFI) of the surface markers CD28, CD154, CD62L, CD2, and CD11a/CD18 on LPS-stimulated or untreated CD4+CD8- T cells (B) and CD8+CD4- T cells (C) (n = 4–5 per group, one-way ANOVA). Data are mean ± SD. * p < 0.05.

