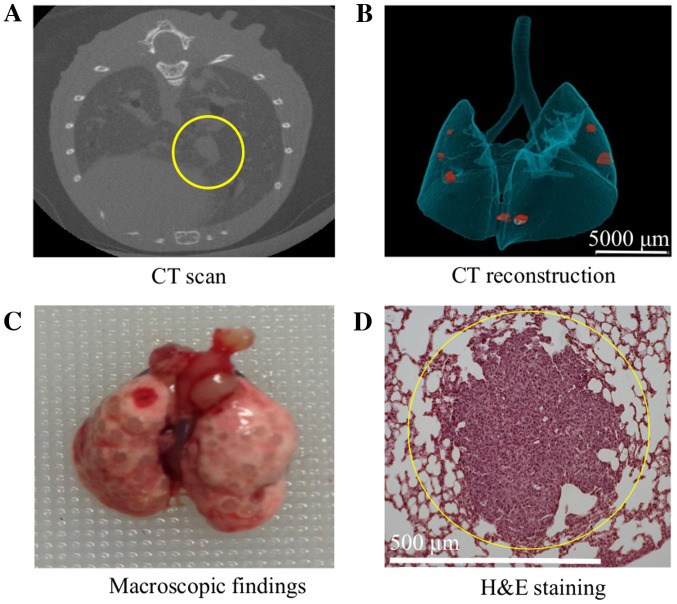
Figure 3.
Pulmonary metastases. (A) A representative two-dimensional image of a CT scan of the pulmonary metastasis mouse model. One nodule was identified in the left lung (circled in yellow). (B) CT reconstruction of the pulmonary metastasis mouse model. Three-dimensional microstructural image data were reconstructed using Tri/3D-BON software. Red colored nodules indicate the pulmonary metastasis. (C) Macroscopic findings of the pulmonary metastasis mouse model. Many nodules were identified in both lungs. (D) H&E staining of the pulmonary metastasis mouse. H&E, hematoxylin-eosin.

