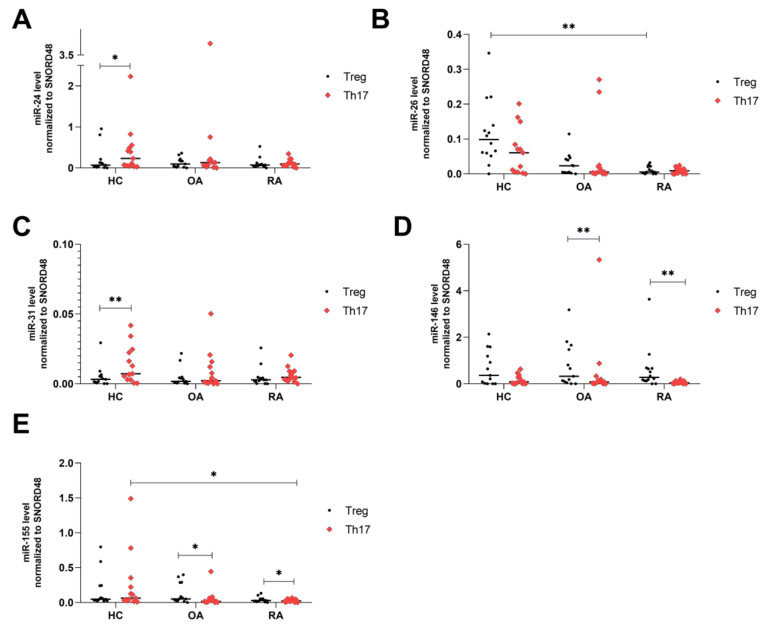
Figure 1.
MicroRNA comparison in Treg and Th17 in healthy controls (HCs), osteoarthritis (OA), and rheumatoid arthritis (RA). MiR-24 level normalized to SNORD48 (A), miR-26 level normalized to SNORD48 (B), miR-31 level normalized to SNORD48 (C), miR-146a level normalized to SNORD48 (D), miR-155 level normalized to SNORD48 (E). Data are presented with the median as the scatterplot graph. Subtypes of Treg vs. Th17 cells within groups were analyzed by the Wilcoxon test. Multiple comparisons of HCs vs. RA vs. OA were conducted with the Kruskal–Wallis test with Dunn’s post hoc. HC (n = 15), OA (n = 11), RA (n = 14). * p < 0.05, ** p < 0.01.

