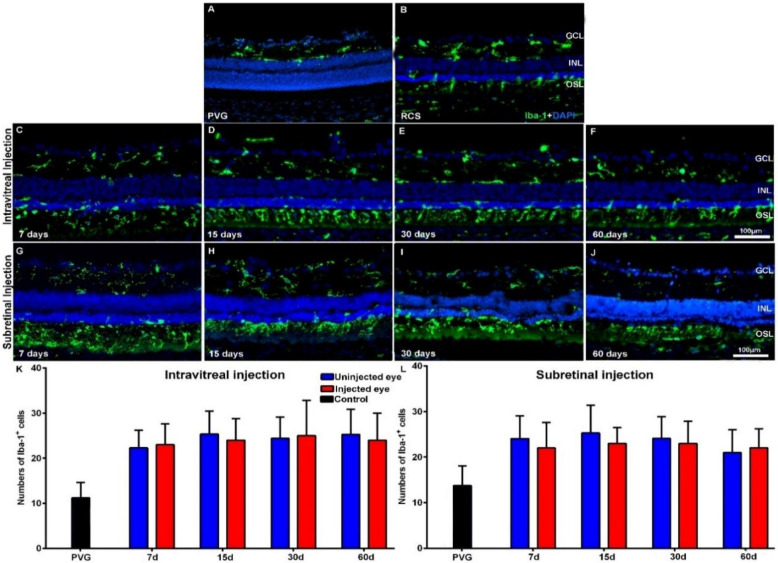
Figure 3.
Microglial cell activation in transplanted RCS rats. Microphotographs of representative retinal cross-sections taken from control Pievald Viro Glaxo (PVG) rats (A), and the right untreated eyes (B) and left treated eyes (C–J) of RCS rats that received IVI (C–F) or SRI (G–J) of hBM-MSCs. Immunostained microglial cells (green; rabbit anti-Iba1 antibody) and also DAPI counterstaining (blue) of the retinas can be observed at different time periods after the injection. Graphs show the mean numbers ± SD of Iba-1+ cells in the retinas of control PVG rats (black bars; include data from both right and left eyes) and in the right uninjected eyes (blue bars) and left eyes (red bars) of RCS rats that received IVI (K) or SRI (L) of hBM-MSCs. No significant differences were observed between right and left eyes at any period. n = 6 eyes for control group and treated eyes group at all time points studied; n = 12 eyes for untreated eyes group at all time points studied. Scale bar: 100 μm. GCL = ganglion cells layer; INL = inner nuclear layer; OSL = photoreceptors outer segment layer.

