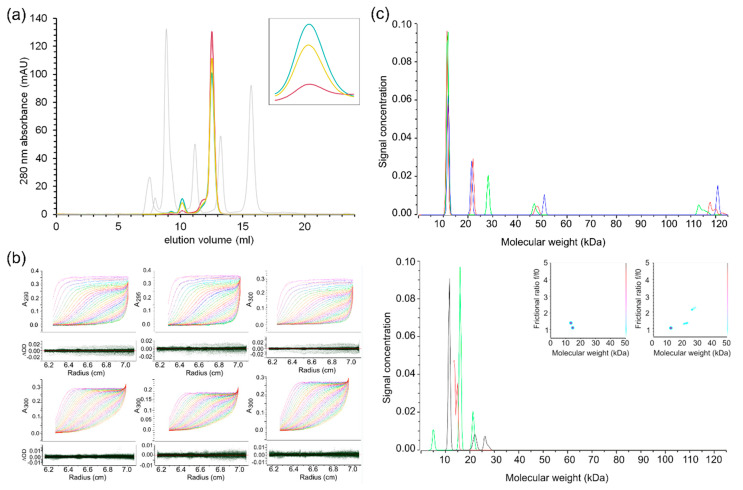
Figure 2.
Biochemical characterization of SARS-CoV-2 nsp10. (a) Analytical size-exclusion chromatography data from a Superdex 75 Increase 10/300 GL column. Freshly purified nsp10 kept at 3 mg/mL (purple); freshly purified nsp10 concentrated to 55 mg/mL, stored for 20 h and then diluted to 3 mg/mL (yellow); freshly purified nsp10 concentrated to 55 mg/mL, stored for 44 h and then diluted to 3 mg/mL (cyan); calibration peaks, from left to right—blue dextran (column void volume, V0 = 7.51 mL), conalbumin (75 kDa, Ve = 8.85 mL), carbonic anhydrase (29 kDa, Ve = 11.16 mL), ribonuclease A (13.7 kDa, Ve = 13.22 mL), aprotinin (6.5 kDa, Ve = 15.68 mL)—are coloured in grey. The major nsp10 peak (Ve = 12.52 mL) corresponds to a molecular weight of 18.9 kDa (interpreted as a monomer), while the minor nsp10 peak (Ve = 10.14 mL) corresponds to a molecular weight of 44.2 kDa (interpreted as a dimer). Inset: dimer peak, close-up view. High protein concentrations and storage increase the dimer-to-monomer ratio. (b) Sedimentation velocity data for nsp10. Protein concentrations of 0.5, 1, 2 and 3 mg/mL were fitted simultaneously to shape and size distributions. Two-dimensional spectrum analysis refined by a genetic algorithm (red curves) fitted to sedimentation velocity data (rainbow curves) is shown for nsp10 at concentrations of 0.5 mg/mL from a 55 mg/mL stock (upper left panel, RMSD = 0.0030), 1 mg/mL from a 55 mg/mL stock (upper middle panel, RMSD = 0.0027), 2 mg/mL from a 55 mg/mL stock (upper right panel, RMSD = 0.0035), 1 mg/mL from a 3 mg/mL stock (lower left panel, RMSD = 0.0017), 2 mg/mL from a 3 mg/mL stock (lower middle panel, RMSD = 0.0015), and 3 mg/mL from a 3 mg/mL stock (lower right panel, RMSD = 0.0018). Residuals are shown in the lower bars. (c) Sedimentation velocity data were analysed individually by a two-dimensional spectrum analysis that simultaneously fits shape and size and was further refined with a genetic algorithm. The resulting molecular weight distributions are shown for data recorded for nsp10 prepared from a stock stored at 55 mg/mL (upper panel) and 3 mg/mL (lower panel) in red (0.5 mg/mL), green (1 mg/mL), blue (2 mg/mL) and black (3 mg/mL). Inserted in the lower panel is a pseudo-3D plot showing the frictional ratio, molecular weight and partial concentration for species present in 2 mg/mL (left) and 3 mg/mL (right) nsp10.

