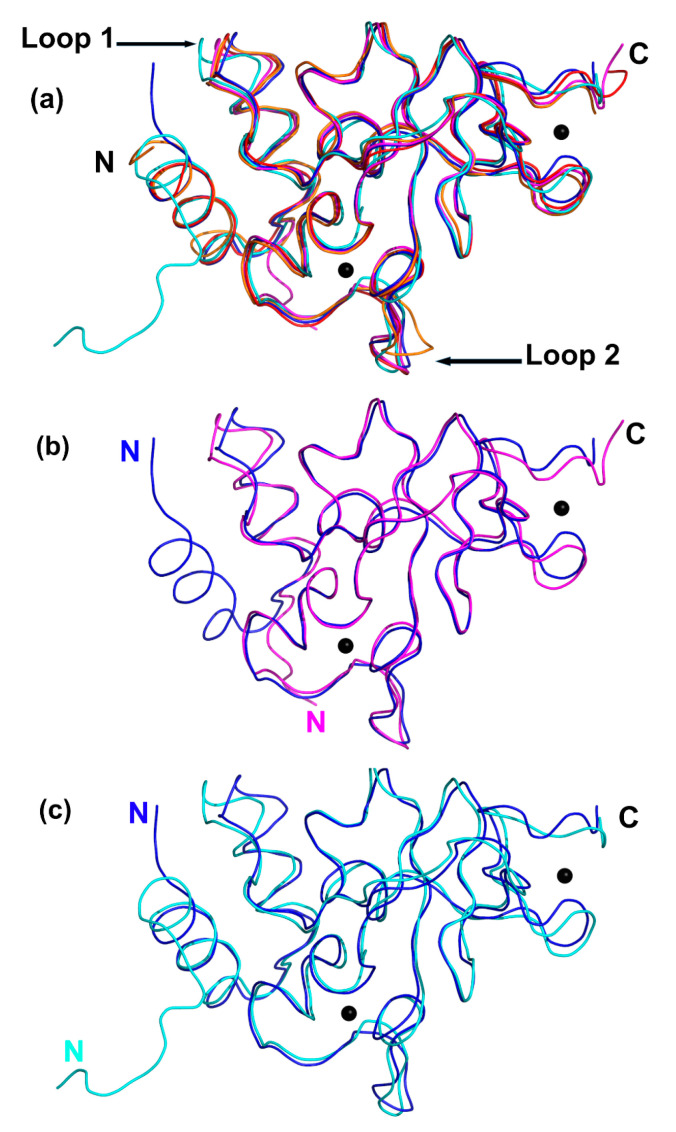
Figure 3.
Structural overlays of unbound nsp10 (this work) compared to bound nsp10 from SARS, MERS and SARS-CoV-2. (a) Overlay of SARS-CoV-2 nsp10 (blue), SARS-CoV-2 nsp10–nsp16 complex (magenta, PDB ID 6w75), unbound SARS nsp10 (red, PDB ID 2fyg), SARS nsp10–nsp14 complex (cyan, PDB ID 5c8u) and MERS nsp10–nsp16 (orange, PDB ID 5yn5). Zn ions are shown as grey spheres. Variable Loops 1 and 2 are indicated by black arrows. (b) Overlay of nsp10 (blue) and nsp10 from nsp10–nsp16 complex from SARS-CoV-2 (magenta; PDB ID 6w75). (c) Overlay of nsp10 (blue) and nsp10 from nsp10–nsp14 complex from SARS (cyan; PDB ID 5c8u).

