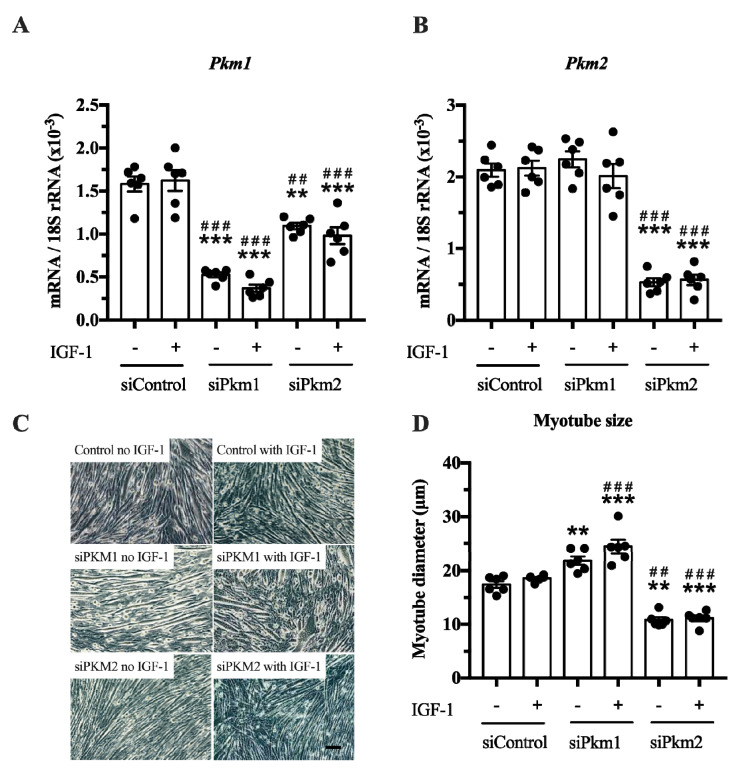
Figure 4.
Effect of Pkm1 or Pkm2 knock down on C2C12 myotube size. (A,B) Pkm1 and Pkm2 mRNA expression following siRNA for Pkm1 and Pkm2 (n = 5). (C,D) C2C12 myotube diameter after siRNA treatment for Pkm1 or Pkm2 (n = 6). Scale bar is 100 μm. Black circles indicate individual data points. * Significantly different to unstimulated siControl (p < 0.05); ** (p < 0.01); *** (p < 0.001)., # significantly different to IGF-1 stimulated siControl (p < 0.05); ## (p < 0.01); ### (p < 0.001), Mann–Whitney U test or two-way ANOVA with Bonferroni post hoc test.

