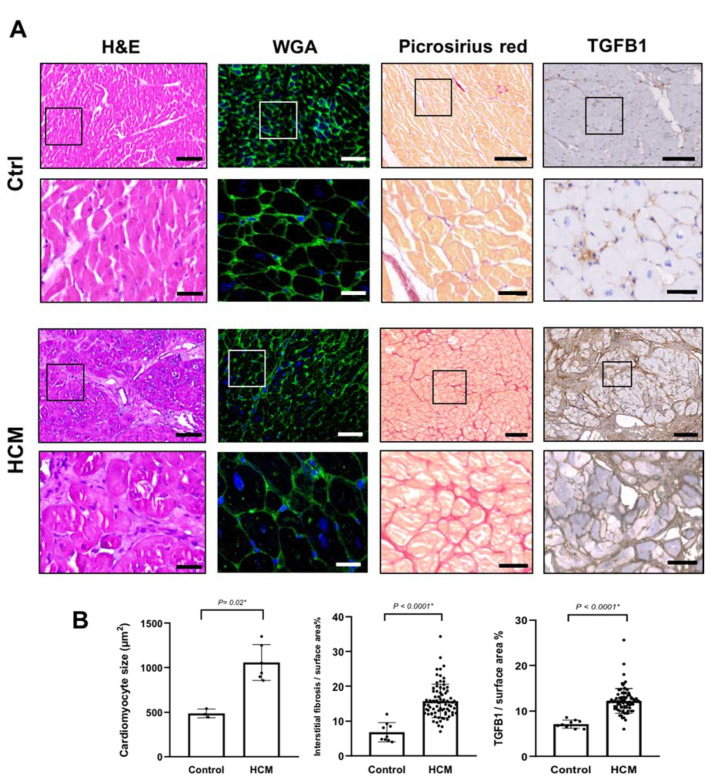
Figure 1.
Histological characterization of HCM myectomy tissues (A) Histological characterization of HCM tissues compared to control tissues using hematoxylin and eosin (H&E) staining, WGA staining, Picro-sirius staining, and TGFβ1 expression, assessed by immunohistochemistry. Scale bars are 100 (overview) and 20 µm (magnified insets). (B) Bar plots show a significant increase of cardiomyocytes size (µm2) (6 HCM vs. 3 ctrls), interstitial fibrosis index (79 HCM vs. 9 ctrls), and TGFβ1 levels (79 HCM vs. 9 ctrls).

