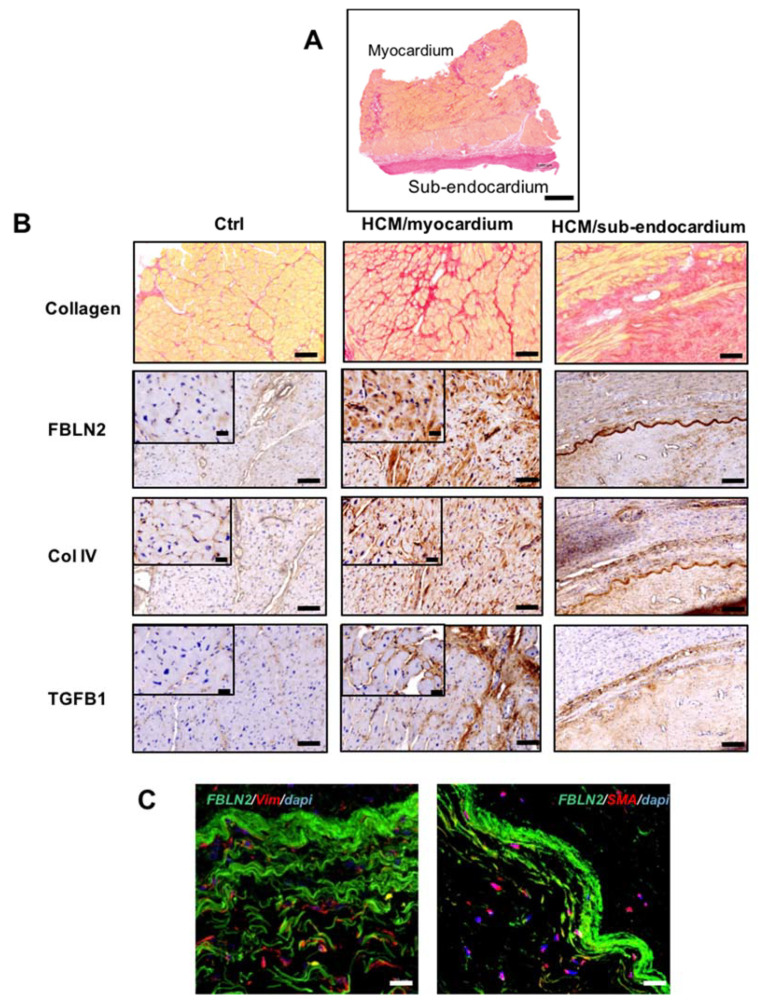
Figure 2.
FBLN2 expression and localization in HCM myectomy tissues along with Col IV and TGFβ1. (A) A representative transmural section of a myectomy specimen stained with picro-Sirius red and shows fibrosis distribution in the myocardium and sub-endocardium. Scale bar is 1 mm. (B) Picro-sirius red and immunohistochemical analysis of HCM tissues at the myocardium and sub-endocardial (n = 79), compared to controls (n = 9), showing FBLN2, Col IV, and TGFβ1 expression. Scale bars are 100 (overview) and 20 µm (magnified insets). (C) Confocal microscopy imaging shows Vim+ and SMA+ cells (red) infiltrating the FBLN2 sheath (green) at the sub-endocardial region (representative of 3 HCMs vs. 3 controls). Scale bars are 20 µm.

