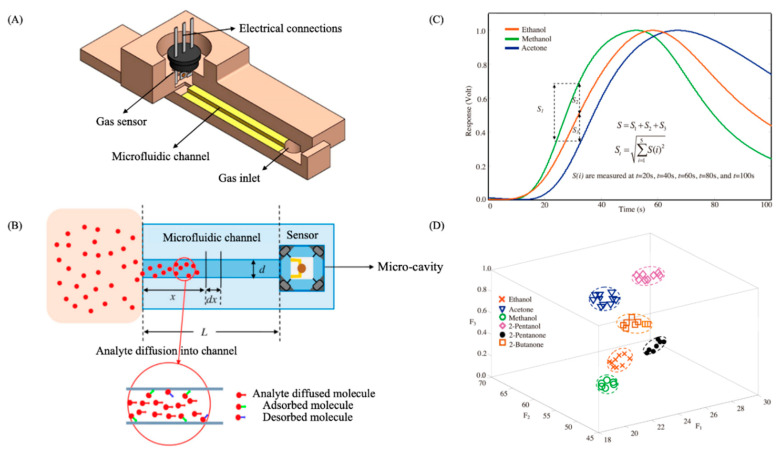
Figure 11.
(A) Schematic diagram of the 3D-printed microfluidic device with a square-based cross-section. (B) Schematic representation of the diffusion and physisorption effect of gas molecules along the microfluidic channel (red dots). (C) Normalized transient response of the microfluidic-based device towards three different VOCs (ethanol, methanol, and acetone). The output signals are shifted onwards due to the selectivity provided by the microfluidic channel. (D) 3D feature space representation of six different analytes at eight different concentration levels (from 250 to 4000 ppm). Reprinted and modified with permission from ref. [254]. Copyright 2016, Elsevier.

