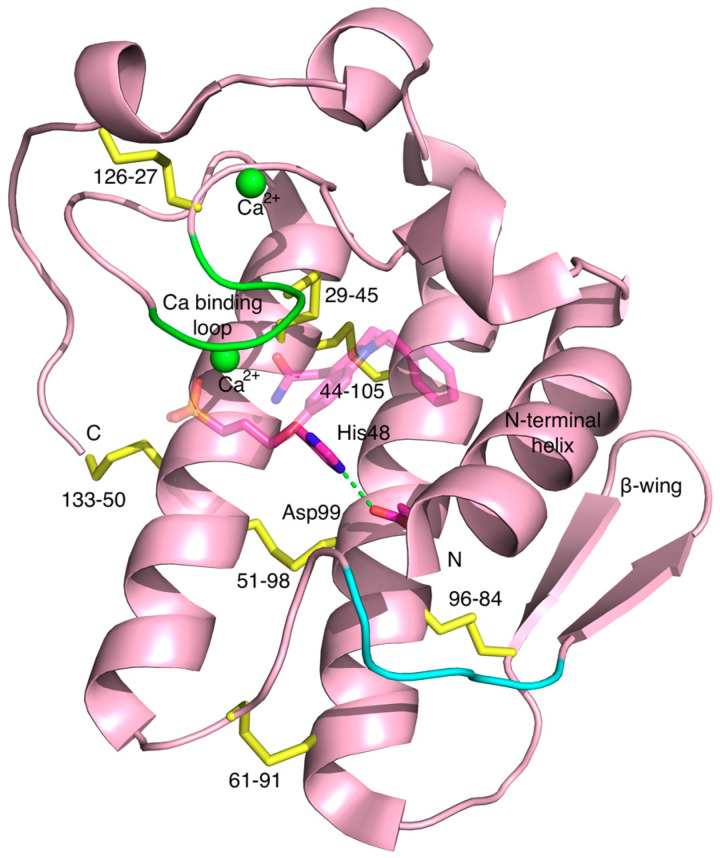
Figure 2.
The three-dimensional structure of hGIIA in which the location of some of the functional and structural groups of hGIIA are depicted. The main chain is shown in cartoon style in cerise except for the cysteines in disulfide bonds (yellow), and the calcium binding loop (green) and calcium ions are also shown (green spheres). His48 and Asp99 with carbons in scarlet are the amino acids that constitute the catalytic dyad. The LY311727 inhibitor is also shown, with scarlet carbons and significantly transparent. Overall structure is native hGIIA (PDB ID 3U8B, 2.3 Å resolution [13]), and the LY311727 is superposed from PDB ID 3U8D (1.8 Å resolution) [13]. The region of the endogenous FLSYK sequence is shown in cyan on the cartoon. N and C represent the N- and C-termini, respectively. Figure created with PyMOL [14].

