Figure 3.
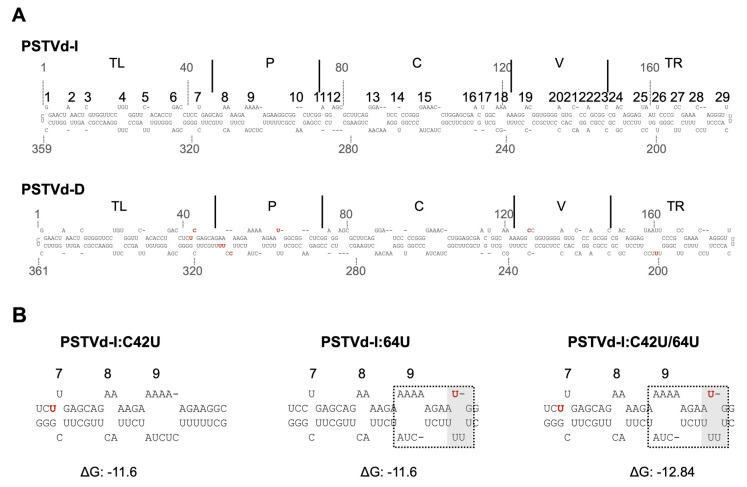
In silico secondary structure prediction of PSTVd mutants. Secondary structure of PSTVd-Iwt, PSTVd-Dwt, PSTVd-I:C42U, PSTVd-I:64U, and PSTVd-I:C42U/64U are predicted in silico using mfold webserver. (A) Full-length structure of PSTVd-Iwt and PSTVd-Dwt are presented. The structural/functional domains of PSTVd: Terminal left (TL), Pathogenicity (P), Central (C), Variable (V), and Terminal right (TR), are delimited by the vertical solid lines and are named accordingly. The 29 loops are numbered from left to right on PSTVd-I. The red colored nucleotides on the PSTVd-Dwt structure represents the nucleotides that are different from PSTVd-Iwt. (B) Enlarged structure of PSTVd-I at the mutated region. The red color nucleotide indicates the mutated nucleotide. Structural changes observed against the PSTVd-Iwt at the site of mutation are shown by a grey box. The dotted box indicates the structural deviation observed in mutants compared to the secondary structure of PSTVd-I. An online tool, PairFold, was used to predict the minimum secondary structure free energy of pairs of RNA sequences.

