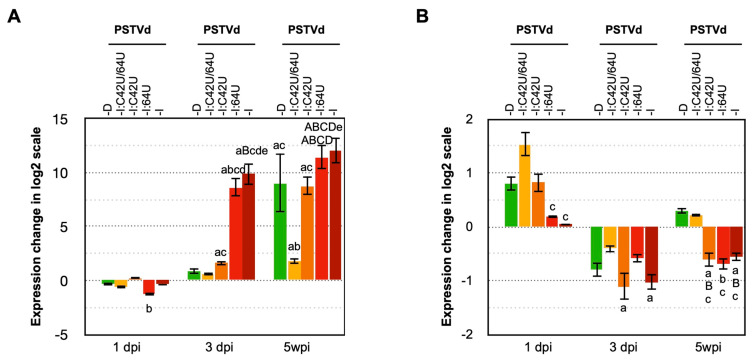
Figure 4.
Effect of PSTVd infection on the expression of PR1b1 and TCHS2. Total RNA extracted from tomato plants inoculated with LMW-RNA of PSTVd-Dwt, PSTVd-Iwt and mutants of PSTVd-I (PSTVd-I:C42U/64U, PSTVd-I:C42U, and PSTVd-I:64U) at 1-, 3- and 5-wpi were assayed by RT-qPCR to analyze the expression level of (A) PR1b1 and (B) TCHS2 mRNAs. The vertical axis indicates the relative expression level (Log2) of mRNAs. The data were normalized by the mean value of the mock-inoculated control at 1-wpi as 1.0. A t-test was performed with a p-value of 0.05. The plants that showed a difference < 0.05 and <0.01 are indicated by lower and capital letters on the top of the bars, respectively. In the figure, significantly difference against the mock-inoculated control plant, PSTVd-Dwt, PSTVd-I:C42U/64U, PSTVd-I:C42U, and PSTVd-I:64U is represented as a or A, b or B, c or C, d or D, and e or E, respectively. Mean values are based on three biological and three technical replicates.

