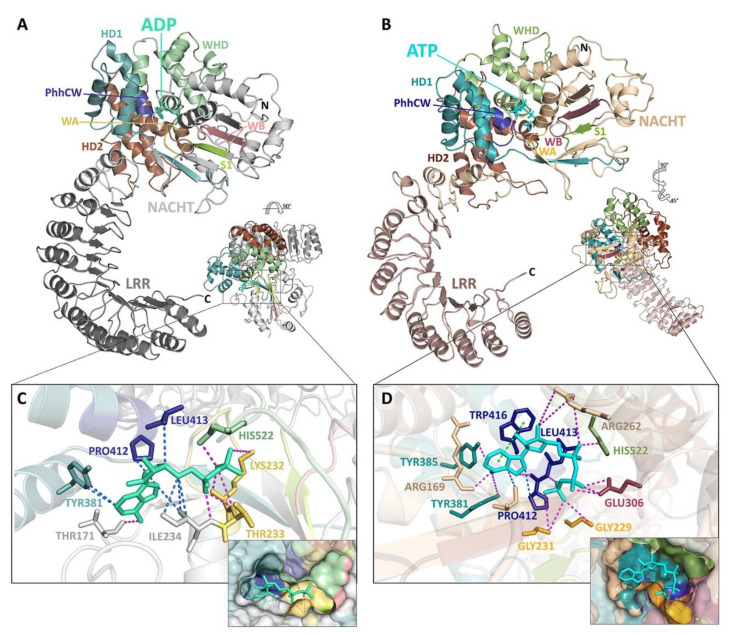
Figure 2.
Molecular dynamic simulations of NLRP3 support distinctions in nucleotide-binding domain structure with occupancy of ATP or ADP ligands. (A) Ribbon diagrams in two orientations of the NLRP3-ADP structure (PDB: 6NPY). Domains are colour-coded and labelled following visual rendering with PyMOL v2.4 (pymol.org). The bound ADP ligand is shown in stick rendering. (B) Ribbon diagrams in two orientations of a representative ATP-bound structure provided with a 10 ns molecular dynamics simulation run with ATP occupancy of the NLRP3 structure (provided by PDB: 6NPY). Domains are colour-coded and labelled, and the bound ATP is shown with stick rendering. The detailed interactions for specific main chain and side chain residues are shown for NLRP3 and ADP (C) determined using the 6NPY structure, or NLRP3 and ATP (D) determined by molecular dynamic simulation. Insets: magnified ligand pocket surface views of the nucleotide-binding domain showing the motifs involved in coordination of the ADP (C) or ATP (D) ligands.

