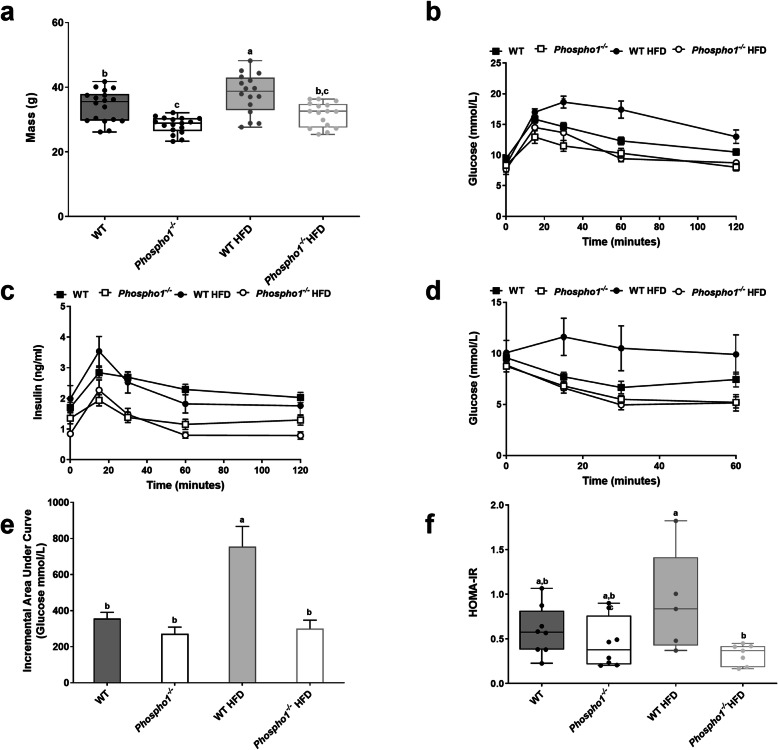
Fig. 2.
Phospho1−/− mice are protected from glucose intolerance. a Body mass. b Glucose tolerance test (GTT). c Glucose stimulate insulin secretion (GSIS). d Insulin tolerance test (ITT). e Incremental area under the curve for GTT. f HOMA-IR. All data are shown as mean ± SEM. b–e 5–8 mice per group. Different letters above the error bar show significant difference at p < 0.05 and the data were assessed as follows: a, e, f Two-way ANOVA with multiple comparisons; b–d repeated measures two-way ANOVA with Sidak’s multiple comparisons test

