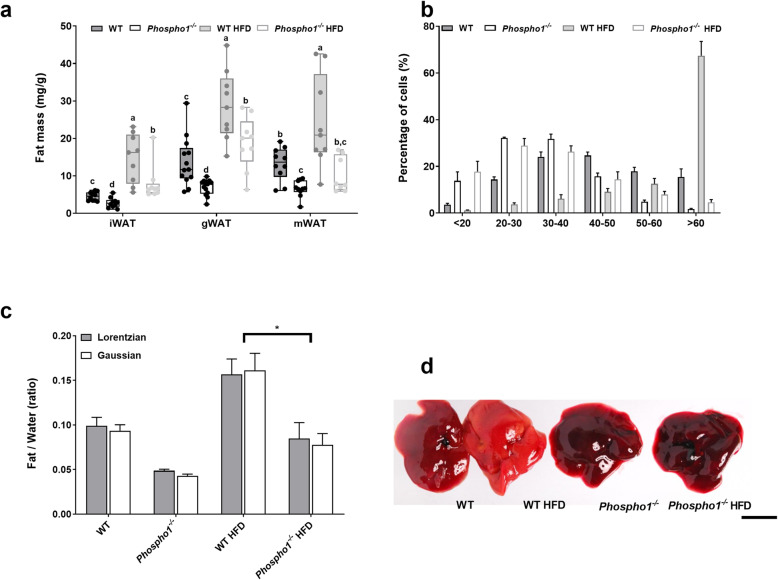
Fig. 3.
Phospho1−/− are protected from NAFLD. a Fat analysis of 120-day-old WT and Phospho1−/− mice on both a control and HFD. b Quantification of gonadal fat adipocyte diameter. c Quantitative assessment of liver fat utilising spectroscopy. d Gross livers of representative mice left to right (WT, WT HFD, Phospho1−/−, Phospho1−/− HFD; scale bar = 10 mm). All data are represented as mean ± S.E.M. b, c n = 3–4 mice per group. *p < 0.05. Different letters above the error bar show significant difference at p < 0.05 and the data were assessed as follows: a–c Two-way ANOVA with multiple comparisons

