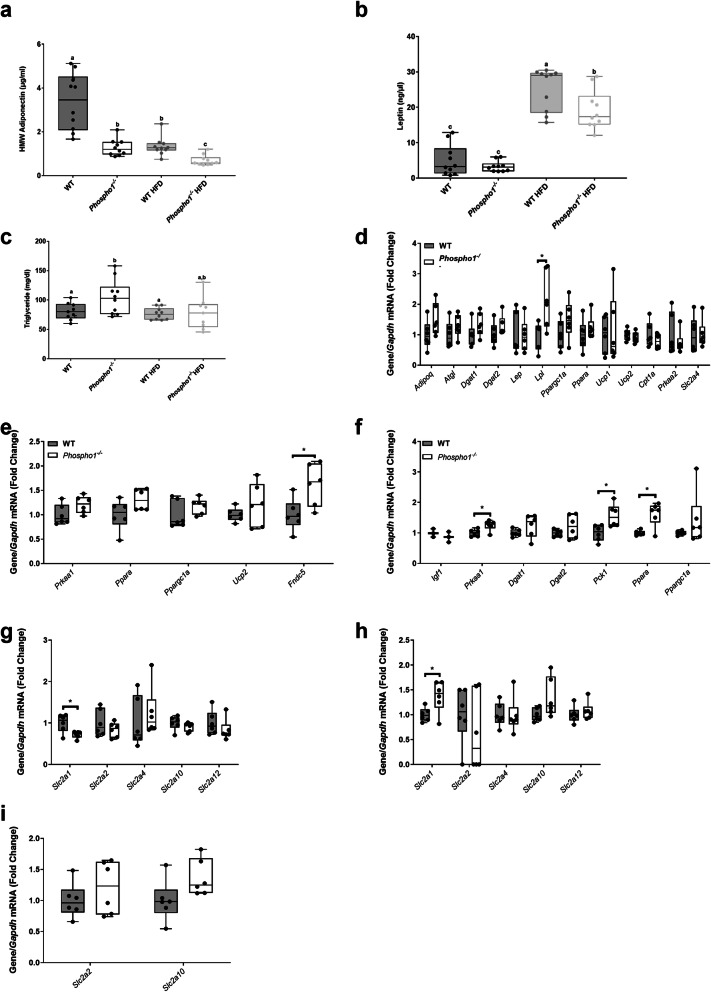
Fig. 4.
Phospho1−/− mice are insulin sensitive despite decreased adiponectin. a Adiponectin, b leptin and c triglyceride serum quantification. RT-qPCR analysis of tissue extracted from 120-day-old WT and Phospho1−/− mice, d adipose tissue, e quadriceps femoris and f liver. RT-qPCR analysis of GLUT receptors from g adipose tissue, h quadriceps femoris and i liver. Data are represented as mean ± S.E.M. * p < 0.05. Different letters above the error bar show significant difference at p < 0.05 and the data were assessed as follows: a–c Two-way ANOVA with multiple comparisons, d–i two-tailed Mann–Whitney test for non-normally distributed data and two-tailed unpaired t test for normally distributed data

