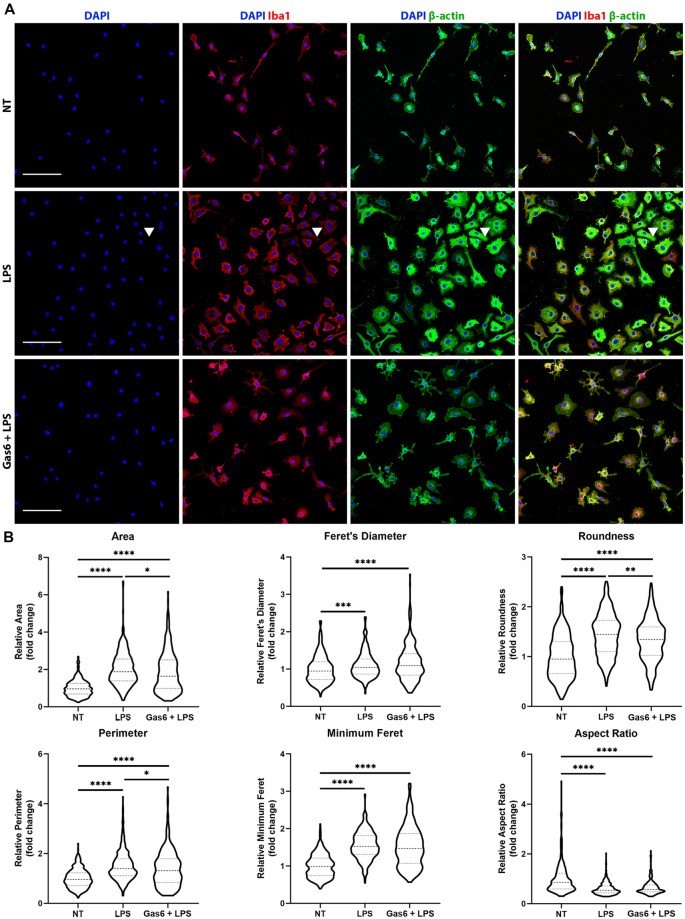
Figure 4.
Gas6 counteracts LPS-induced changes in microglial morphology. (A) Representative images of primary microglial cultures treated with LPS (10 ng/ml for 19 h) with or without 1 h pre-treatment with Gas6 (1.6 μg/ml). Cells were stained with DAPI, Iba1, and β-actin and imaged under fluorescence confocal microscopy. Scale bar −100 μm. Arrowheads indicate a multinucleated cell. (B) Quantification of morphological characteristics (area, Feret’s diameter, roundness, perimeter, minimum Feret, and aspect ratio) for n = 4 individual experimental repeats (n > 300 cells per treatment group). Data normalized to the control no treatment (NT) group is displayed as fold change on violin plots showing median and upper/lower quartiles. Statistical tests used were one-way analysis of variance (ANOVA) with Tukey post hoc analysis; *p < 0.05; **p < 0.01; ***p < 0.001; ****p < 0.0001.

