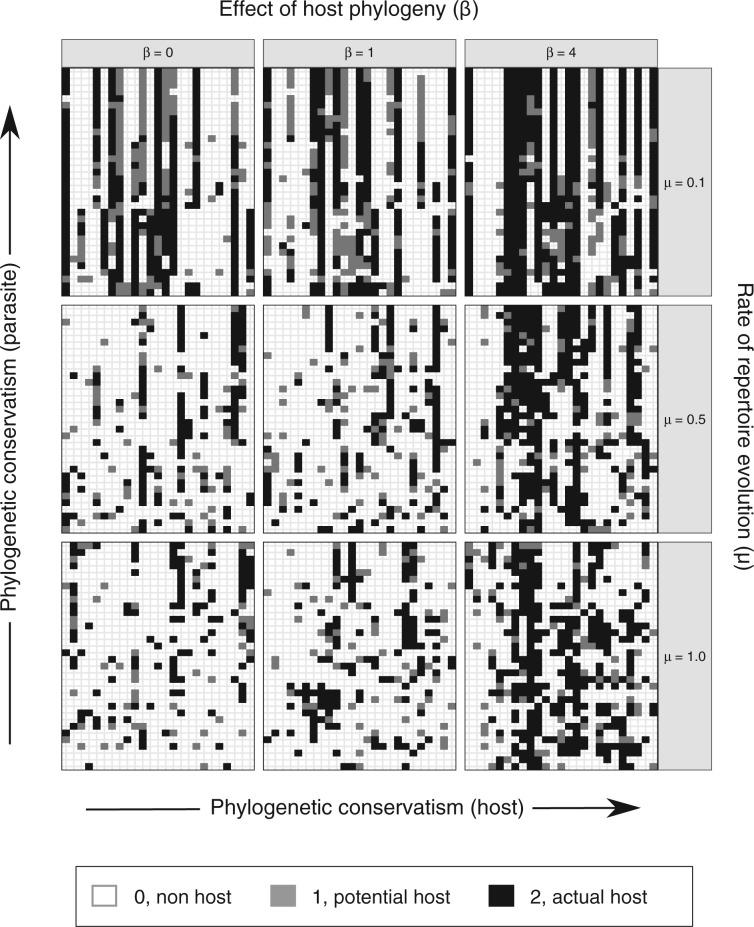
Figure 2.
Simulated data sets for nine parameter combinations. Interactions between Nymphalini butterflies and their host plants for one of 50 simulations with each parameter combination. In each of the nine data sets, each column represents one host in the repertoire and each row shows the host repertoire of one butterfly species. Rows and columns are ordered by butterfly and plant phylogeny, respectively. When phylogenetic conservatism in host–parasite interactions is low for both hosts and parasites, the interactions are more randomly spread (matrix at bottom-left corner). As phylogenetic conservatism among parasites increases, host repertoires (rows) become more similar (upper matrices). When there is phylogenetic conservatism among hosts, host repertoires include more closely related hosts (neighboring columns; matrices to the right).

