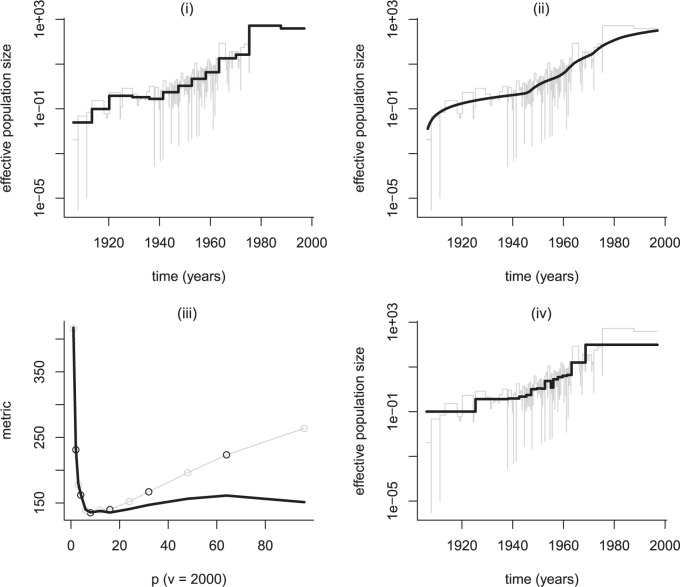
Figure A4.
HIV demographic estimates. We estimate the effective population size history underlying an empirical HIV phylogeny with  coalescent events. All tips of this tree are sampled in 1997 from the Democratic Republic of Congo. We plot the generalized skyline, the multiple change-point method and the FIA-optimized skyline estimates in (i), (ii), and (iv) in black against the classic skyline in grey. In (iii), we show the optimization over
  of the FIA (black) against its associated BIC (grey).

