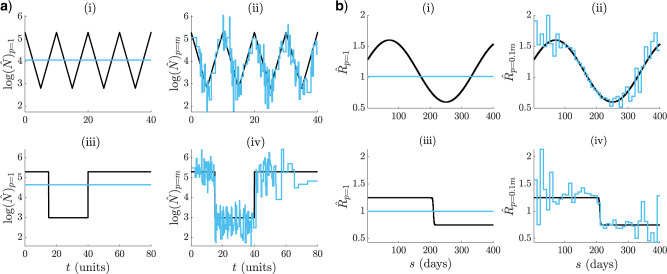
Figure 2.
Skyline and renewal model under and overfitting. Small  leads to smooth but biased estimates characteristic of underfitting ((i) and (iii) in (a) and (b)). Large
  results in noisy estimates that respond well to changes. This is symptomatic of overfitting ((ii) and (iv) in (a) and (b)). The MLEs (
 or
or  ) are in blue and the true
  or
or  in black. Panel (a) shows cyclic and bottleneck skyline models at
  and (b) focuses on sinusoidal and sigmoidal renewal models at
  .
.

