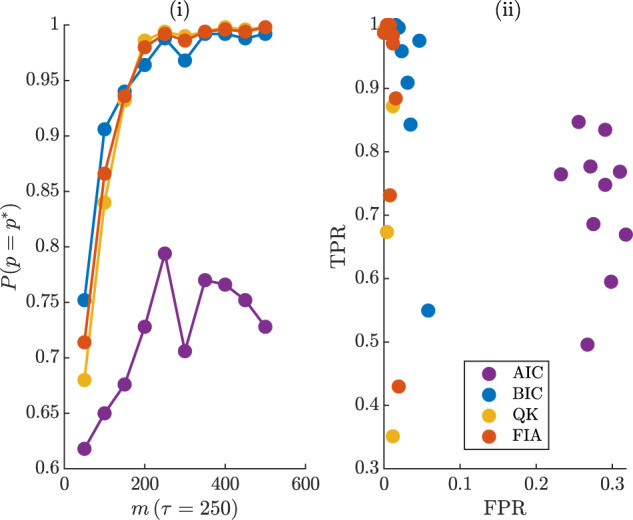
Figure A2.

Binary skyline model selection. We simulate 500 conditionally independent phylogenies from skyline models and test the classification ability of model selection criteria. The null model is a Kingman coalescent with  , and the alternative features a sharp fall to
  at
at  time units. The sampled tips of the phylogeny are introduced at
  and
and  only. Graph (i) gives the probability of correct classification
  as a function of data size
  . The FIA performs best, on average, but the BIC is better at small
  . Graph (ii) gives the true (TPR) and false positive rates (FPR) of the metrics. The FIA and QK have the best overall rates.
