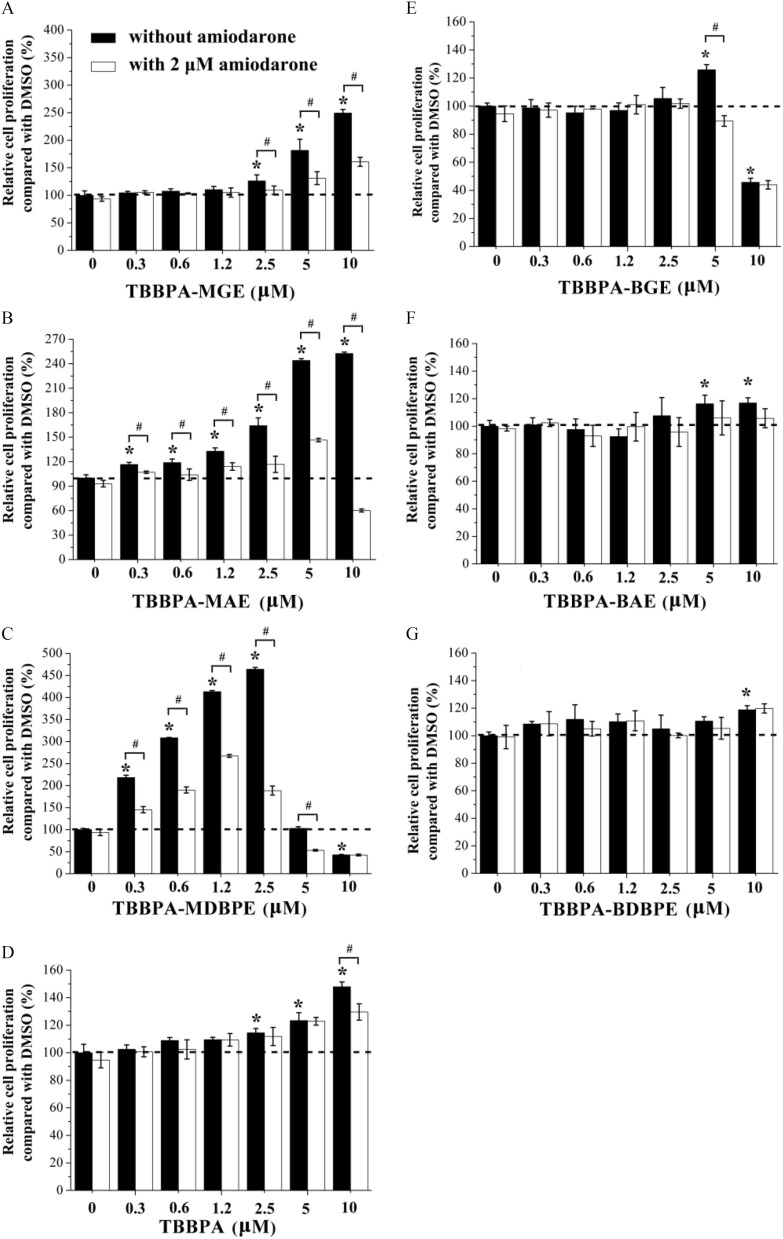
Figure 5.
Agonistic activity of the tetrabromobisphenol A (TBBPA) mono-ether structural analogs [(A) TBBPA-mono(glycidyl ether) (TBBPA-MGE), (B) TBBPA-mono(allyl ether) (TBBPA-MAE), and (C) TBBPA-mono(2,3-dibromopropyl ether) (TBBPA-MDBPE)], (D) TBBPA, and the TBBPA bis-ether derivatives [(E) TBBPA-bis(glycidyl ether) (TBBPA-BGE), (F) TBBPA-bis(allyl ether) (TBBPA-BAE), and (G) TBBPA-bis(2,3-dibromopropyl ether) (TBBPA-BDBPE)] determined by the GH3 cell proliferation assay. GH3 cells were treated with different concentrations of the tested chemicals in the presence or absence of amiodarone. Three replicated wells were included for each group in a 96-well plate. Error bars represent the standard deviation of three replicates. Relative cell proliferation values were calculated by dividing the absorbance value at of the control group (0.1% DMSO) by that of each cell sample based on the Cell Counting Kit-8 assay. *, compared with cell samples of the control group (0.1% DMSO). #, compared with cell samples treated without amiodarone. The -values of the experimental data were analyzed using a one-way analysis of variance, followed by a least significant difference multiple comparisons test (IBM SPSS Statistics 20). See the summary data in Table S9. Note: DMSO, dimethyl sulfoxide.

