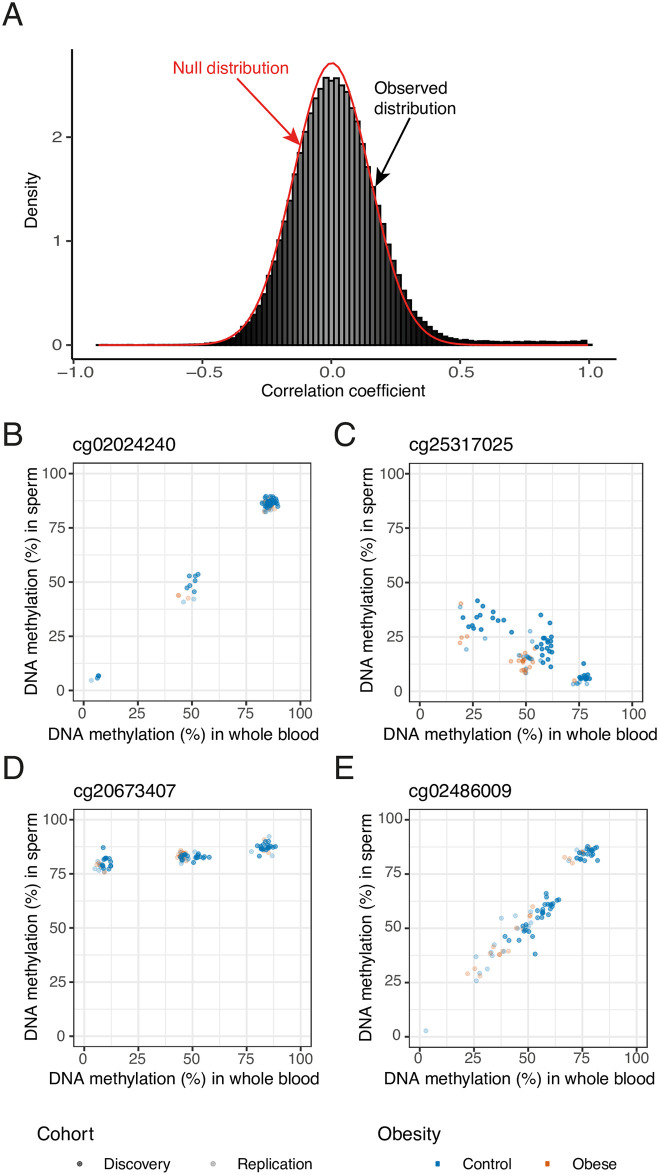
Fig 4. Covariation of DNA methylation between blood and sperm.
(A) The observed correlation of DNA methylation levels in sperm and blood (histogram) is plotted against the estimated null distribution (red density curve). A small percentage of sites display highly correlated DNA methylation levels (r > 0.8), and the observed distribution is overall slightly shifted to the right compared to the null distribution. (B) cg02024240 (chr5:159669974) shows a strong DNA methylation correlation between blood and sperm and a trimodal methylation pattern suggestive of a genetically driven effect (r > 0.99, P = 4.68 × 10−48). (C) cg25317025 (chr18:47019823) is one of 30 sites showing a negative correlation between blood and sperm (r = -0.89, P = 5.14 × 10⁻¹⁷). (D) Some probes display striking differences in variability between the two tissues: cg20673407 (chr10:31040939) is characterized by a distinct trimodal pattern in whole blood while showing less overall variability in sperm (r = 0.82, P = 1.45 × 10⁻¹²). (E) Only 6 of the significantly correlated probes have no known SNPs anywhere in the probe sequence. cg02486009 (chr15: 22428395) is one of these (r = 0.96, P = 1.90 × 10⁻²⁷). Nonetheless it shows a bimodal DNA methylation pattern in both tissues, suggestive of a genetically driven effect.

