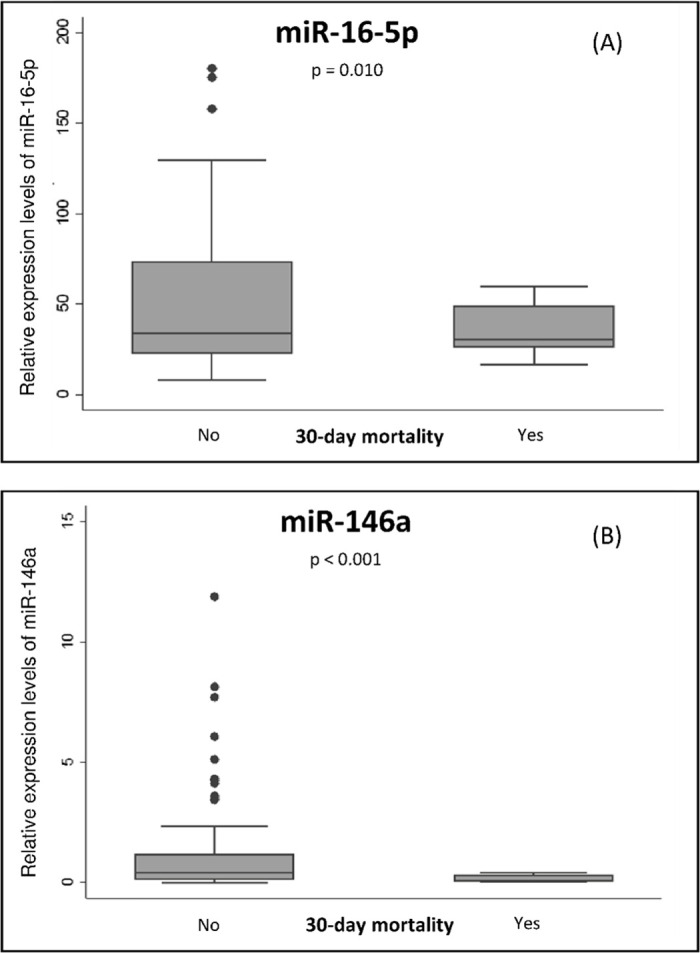
Fig 1. Relative expression levels (FCs) at admission of miR-16-5p (A) and miR-146a (B) according to 30-day mortality after hospitalization for CAP.

Data are represented as box plots. Dots represent outliers. Differences were analyzed by Student´s t test for unequal variances p values ≤ 0.05 are considered statistically significant.
