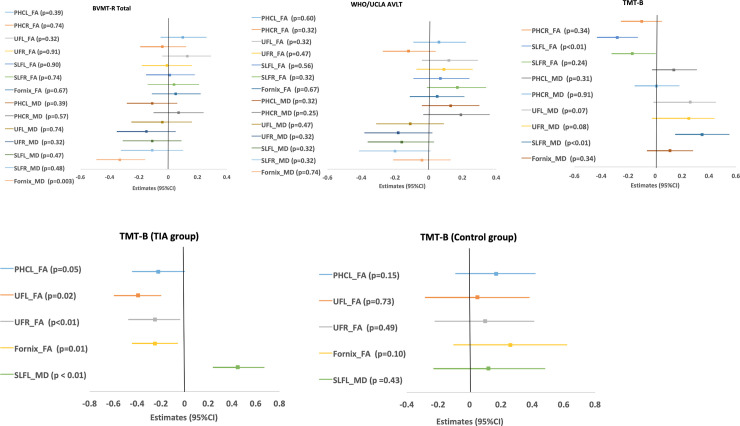
Fig 2.
(A) Forest plots of the point estimates and 95% confidence interval (CI) for the relationship between DTI tracts and cognitive tests (TIA or non-TIA did not modify the relationships). Notes: The adjusted covariates include age, sex, premorbid intellect, group (TIA or non-TIA subjects), and WM hyperintensities volume. BVMT-R = Brief Visuospatial Memory Test-Revised; WHO/UCLA-AVLT: WHO/UCLA Auditory Verbal Learning Test; TMT-B: Trails Making Test. PHCL = parahippocampus, left; PHCR = parahippocampal cingulum, right; UFL = uncinate fasciculus, left; UFR = uncinate fasciculus, right; SLFL = superior longitudinal fasciculus, left; SLFR = superior longitudinal fasciculus, right. For BVMT-R total and WHO/UCLA AVLT related regressions. (B) Forest plots of the point estimates and 95% confidence interval (CI) for the relationship between DTI tracts and cognitive tests (TIA group modified the relationships). Notes: Results presented were based on multiple linear regressions where two-way interactions were significant statistically. The adjusted covariates including age, sex, premorbid intellect, group (TIA or non-TIA), and WM hyperintensities volume. TMT-B: Trails Making Test. PHCL = parahippocampus, left; UF = uncinate fasciculus, (L for left and R for right); SLFL = superior longitudinal fasciculus, left.

