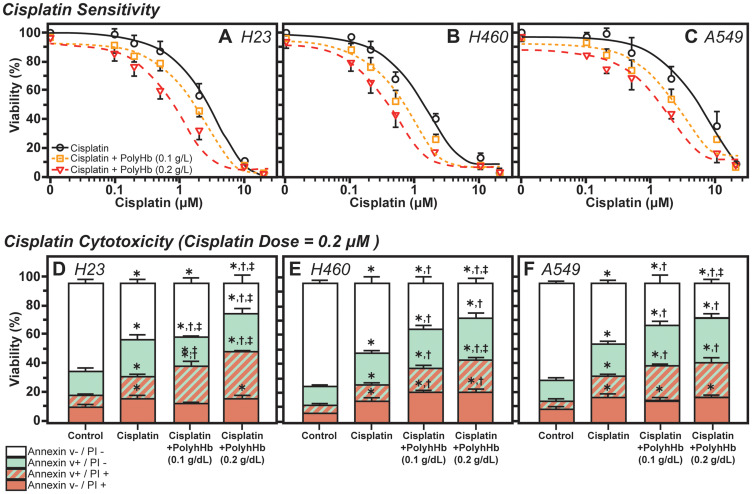
Figure 3. Effects of Cisplatin and PolyHb on cell viability and cytotoxicity.
(TOP) Shift in cisplatin sensitivity in (A) H23, (B) H460, and (C) A549 cell lines upon addition of 0.1 or 0.2 g/dL of PolyHb. Curves represent the mean percentage of viable cells (mean ± SD) relative to 0 μM cisplatin (n = 5 total). (BOTTOM) Cisplatin cytotoxicity in (D) H23, (E) H460, and (F) A549 cell lines upon addition of 0.1 or 0.2 g/dL of PolyHb (mean ± SD, n = 5). The cisplatin dose was 0.2 μM in all groups treated for 48 h. *significant with respect to the control group; †significant with respect to the cisplatin-only group; ‡significant with respect to the cisplatin + PolyHb (0.1 g/dL) group.

