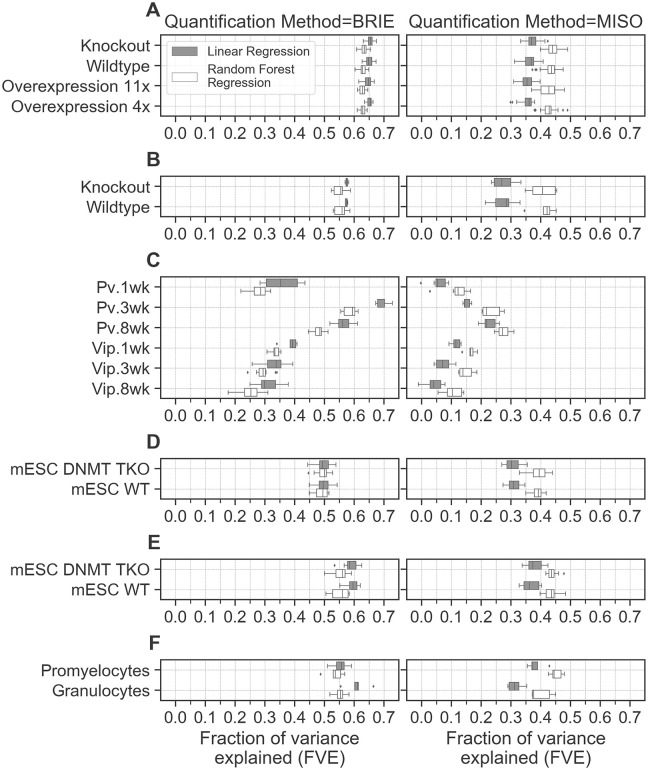
Fig 1. Fraction of variance explained by regressing sequence features against splicing ratios.
(A) Cultured human neurons expressing multiple levels of MeCP2 [9](B) Wildtype (WT) and MeCP2 Knockout (KO) brain tissue [17](C) Pv and Vip neurons at 1 week, 3 weeks and 8 weeks [20] (D) DNMT-TKO and WT mESCs [18](E) DNMT-TKO and WT mESCs [19] (F) Promyelocytes and Granulocytes [14, 23]. See Table 1 for detailed information about data sets.

