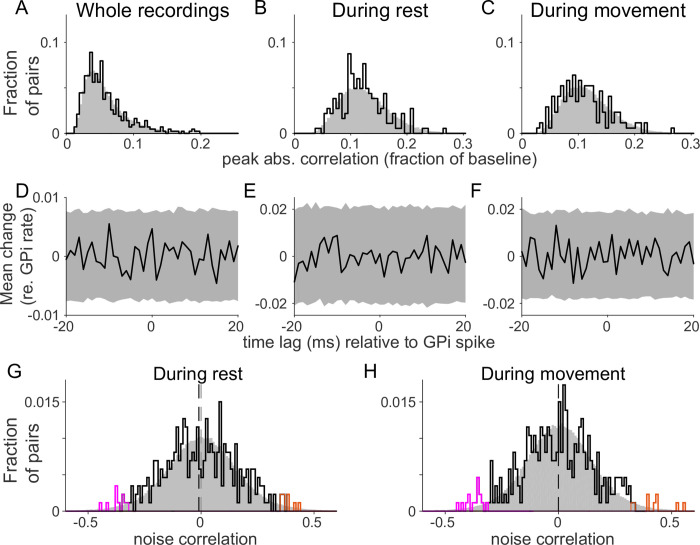
Fig 4.
Absence of fast correlations between GPi and VLa spikes. (A-C) Histograms of peak absolute (“abs.”) CCF values between GPi and VLa units (black) for whole recordings (A), during rest (B) and during movement (C). Jitter control distributions (20-ms jitter intervals) are shown in gray. (D-F) Population average CCFs (black) and 95% confidence intervals (gray) based on the jitter control. (G-H) Low noise correlations between GPi and VLa during both rest (G) and movement (H). Noise correlations exceeding the 95% confidence limits are shown in orange (positive) and magenta (negative). Dashed vertical lines indicate the medians of the distributions. For both rest and movement, test distributions did not differ significantly from the control distribution (gray). No significant bias toward positive or negative correlations was found. Data and code to reproduce this figure can be found in https://doi.org/10.5061/dryad.0cfxpnvxm (Fig4_S10to13.m). CCF, cross-correlation function; GPi, globus pallidus-internus; VLa, ventrolateral anterior nucleus.

