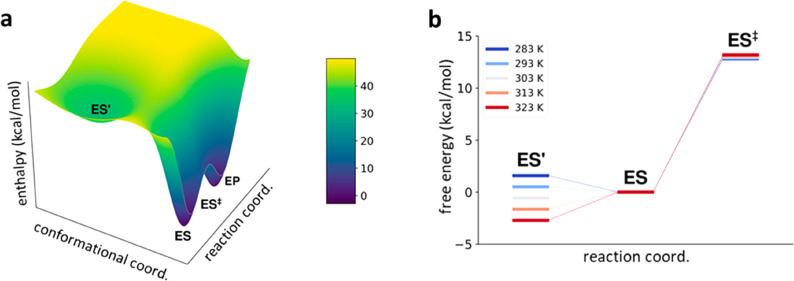
Figure 5.
(a) Schematic enthalpy diagram for the AHA-catalyzed reaction using the values obtained from fitting to the equilibrium model of eq 3. (b) Corresponding free energy diagram in the temperature range between 283 K (blue) and 323 K (red), where it can be seen that the lowest-energy reactant state shifts from ES to ES′ around room temperature.

