Figure 3.

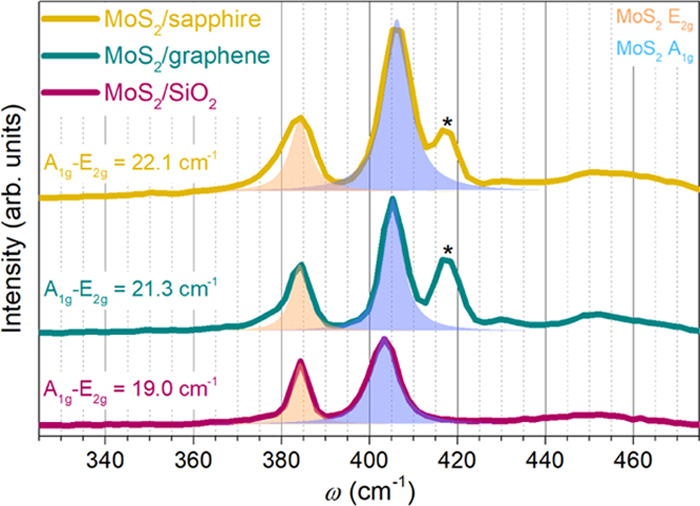
Raman spectra of discrete MoS2 islands on three substrates. Raman spectra are normalized to MoS2 E2g peaks. The sapphire A1g peaks were marked with asterisks.

Raman spectra of discrete MoS2 islands on three substrates. Raman spectra are normalized to MoS2 E2g peaks. The sapphire A1g peaks were marked with asterisks.