Figure 5.

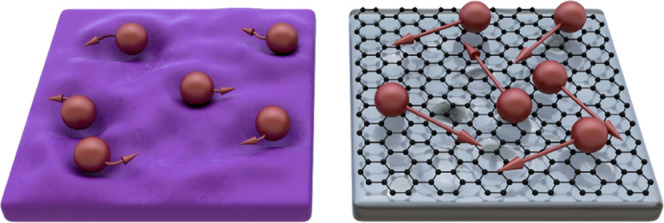
Schematic representations of the movement of the adsorbed MoS2 species (red balls) on SiO2 (left) and graphene/sapphire (right). The valleys on the SiO2 surface represent high-energy binding sites. The schematic is not to scale.

Schematic representations of the movement of the adsorbed MoS2 species (red balls) on SiO2 (left) and graphene/sapphire (right). The valleys on the SiO2 surface represent high-energy binding sites. The schematic is not to scale.