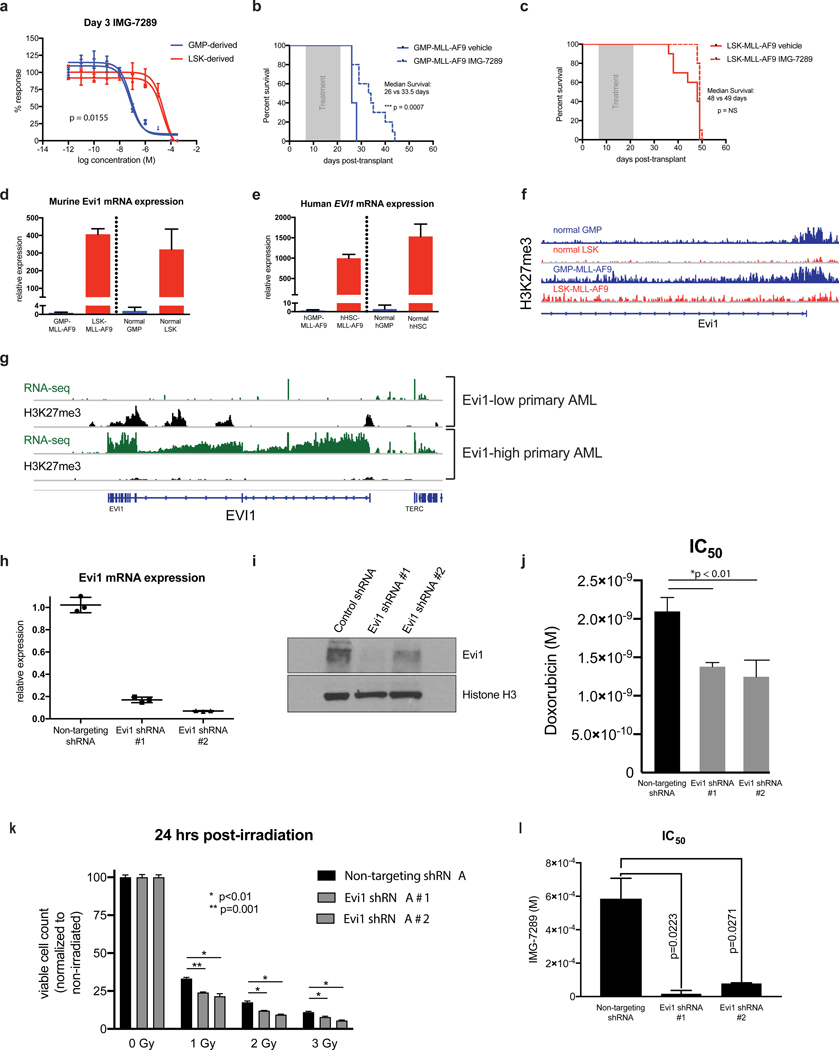
Figure 1. Differential sensitivity of LSK- and GMP-derived MLL-AF9 leukemias to LSD1 inhibition is Evi1-dependent.
(A) Independent murine LSK- and GMP-derived MLL-AF9 leukemias were treated for 3 days with variable concentrations of IMG-7289 in vitro. Cell Titer Glo assays were used to quantitate viable cells cultured in triplicate wells and percent response was derived by normalizing to corresponding cells cultured in DMSO vehicle control. (B) Wild-type C57BL/6 mice engrafted with 5×10⁴ syngeneic GMP-MLL-AF9 cells were treated via oral gavage daily with IMG-7289 at a dose of 25 mg/kg (N=12 mice) or vehicle control (N=12 mice) during a 14-day treatment window (grey box). Kaplan-Meier survival curves comparing IMG-7289-treated and vehicle treated mice are shown. (C) Wild-type C57BL/6 mice engrafted with 5×10⁴ syngeneic LSK-MLL-AF9 cells were treated via oral gavage daily with IMG-7289 at a dose of 25 mg/kg (N=12 mice) or vehicle control (N=12 mice) during a 14-day treatment window (grey box). Kaplan-Meier survival curves comparing IMG-7289-treated and vehicle treated mice are shown. (D) qRT-PCR was performed to measure abundance of Evi1 transcripts in GMP-MLL-AF9, LSK-MLL-AF9, normal sorted GMP cells, and normal sorted LSK cells from C57BL/6 wild-type mice. Bar graphs shown represent pooled biological replicates from 3 independent leukemias and 3 independent sorted LSKs and GMPs. (E) qRT-PCR data assessing Evi1 mRNA levels in human cord blood GMP- and HSC-derived MLL-AF9 leukemias engrafted in sublethally irradiated NSG mice and normal human cord blood GMP and HSC cells. (F) H3K27me3 ChIP-seq tracks at the Evi1 locus of normal GMP and LSK cells from previously published datasets(21). Representative H3K27me3 ChIP-seq tracks are also shown from GMP-MLL-AF9 and LSK-MLL-AF9 cells. (G) RNA-seq (green) and H3K27me3 (black) ChIP-seq tracks at the EVI1 locus from MLL-rearranged AML patient samples (N=3) exhibiting either high or low expression of EVI1. (H) qRT-PCR expression analysis of Evi1 from LSK-MLL-AF9 cells transduced with either a non-targeting control shRNA or two independent shRNAs targeting Evi1. (I) Western blot analysis of LSK-MLL-AF9 cells expressing control shRNA or Evi1 shRNAs as in H. (J) Bar plots representing IC50 values from 3 independent Cell Titer Glo doxorubicin kill curve assays using LSK-MLL-AF9 cells expressing non-targeting control shRNA or Evi1 shRNAs. (K) Bar plots depicting normalized viable cell counts 24 hours after exposure to ionizing radiation (0, 1, 2, or 3 Gy), comparing LSK-MLL-AF9 cells transduced with either a non-targeting control shRNA or two independent shRNAs targeting Evi1. Data shown are representative of 3 independent experiments. (L) Bar plots representing IC50 values from 3 independent Cell Titer Glo IMG-7289 kill curve assays using LSK-MLL-AF9 cells expressing non-targeting control shRNA or Evi1 shRNAs.

