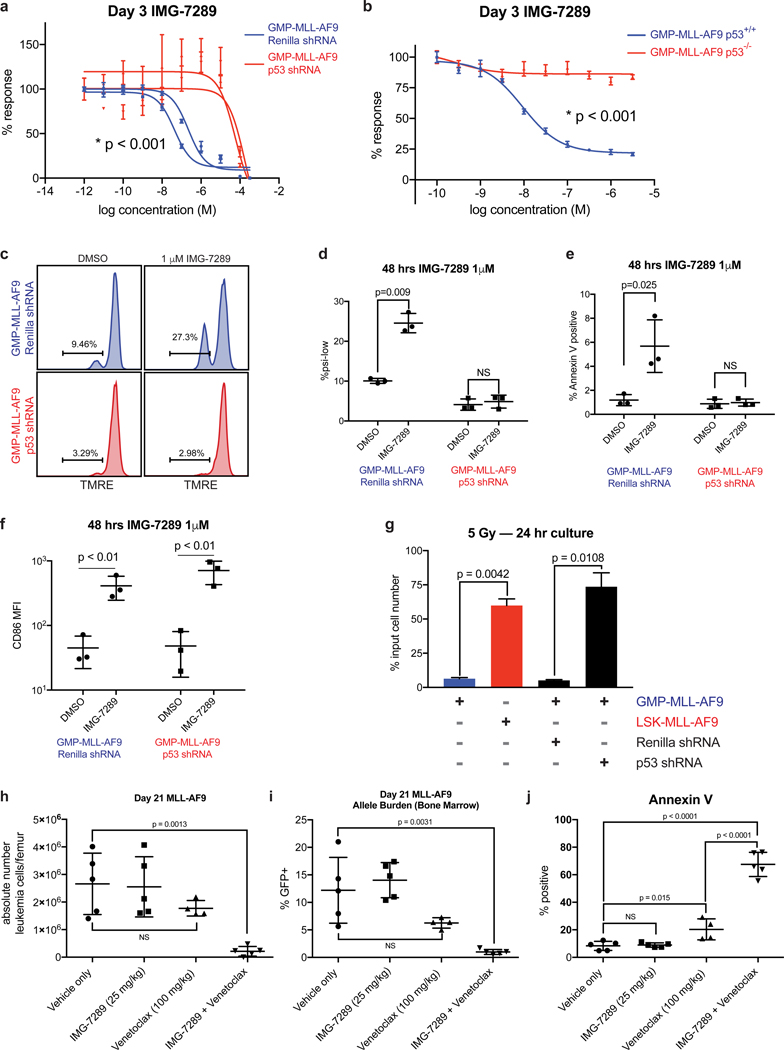
Figure 4. p53 loss in sensitive GMP-MLL-AF9 leukemias induces resistance to the pro-apoptotic but not pro-differentiation effects of LSD1 inhibition.
(A) GMP-MLL-AF9 cells were transduced with shRNAs targeting Renilla luciferase control or p53 and assayed in Cell Titer Glo IMG-7289 kill curves. Data shown are representative of 4 independent experiments. (B) Primary MLL-AF9 leukemias arising from GMPs derived from either p53 wild-type or p53−/− mice were assessed for IMG-7289 sensitivity in vitro by Cell Titer Glo kill curves. Data shown are representative of 4 independent experiments. (C) GMP-MLL-AF9 cells expressing shRNAs targeting Renilla or p53 were treated for 48 hours at 1 μM IMG-7289 and TMRE fluorescence was measured by flow cytometry. Statistical analyses summarized in (D). Data shown are representative of 4 independent experiments. (D) Summary scatter plots depicting the percentage of cells within the ψlow gate defined by TMRE flow cytometry in C. (E) Summary plots showing the proportion of Annexin V+ apoptotic cells after GMP-MLL-AF9 cells expressing shRNAs targeting Renilla or p53 were treated for 48 hours at 1 μM IMG-7289. (F) GMP-MLL-AF9 cells expressing shRNAs targeting Renilla or p53 were treated for 48 hours at 1 μM IMG-7289 and assessed for cell surface CD86 expression by flow cytometry. Scatter plots depicting mean fluorescence intensity of CD86 staining is shown. Data shown are representative of 3 independent experiments. (G) 2×10⁵ parental GMP-MLL-AF9, GMP-MLL-AF9 expressing Renilla shRNA, GMP-MLL-AF9 expressing p53 shRNA, and LSK-MLL-AF9 cells were irradiated (5 Gy). Viable cells were enumerated after culturing for 24 hours post-irradiation. Bar plots represent viable cell counts as a percentage of input cell number. (H) C57BL/6 wild-type mice were engrafted with resistant LSK-MLL-AF9 cells and treated via oral gavage with vehicle (N=5), IMG-2789 alone (25 mg/kg, N=5), venetoclax alone (100 mg/kg, N=5), or combination IMG-2789 (25 mg/kg) and venetoclax (100 mg/kg, N=5) during a 14-day treatment window. At day 21 post-transplant, bone marrow cells were harvested and viable GFP+ leukemia cells were enumerated per femur. (I) Percentages of GFP+ AML cells within the bone marrow are shown, and (J) proportions of Annexin V+GFP+ apoptotic leukemia cells are shown.

