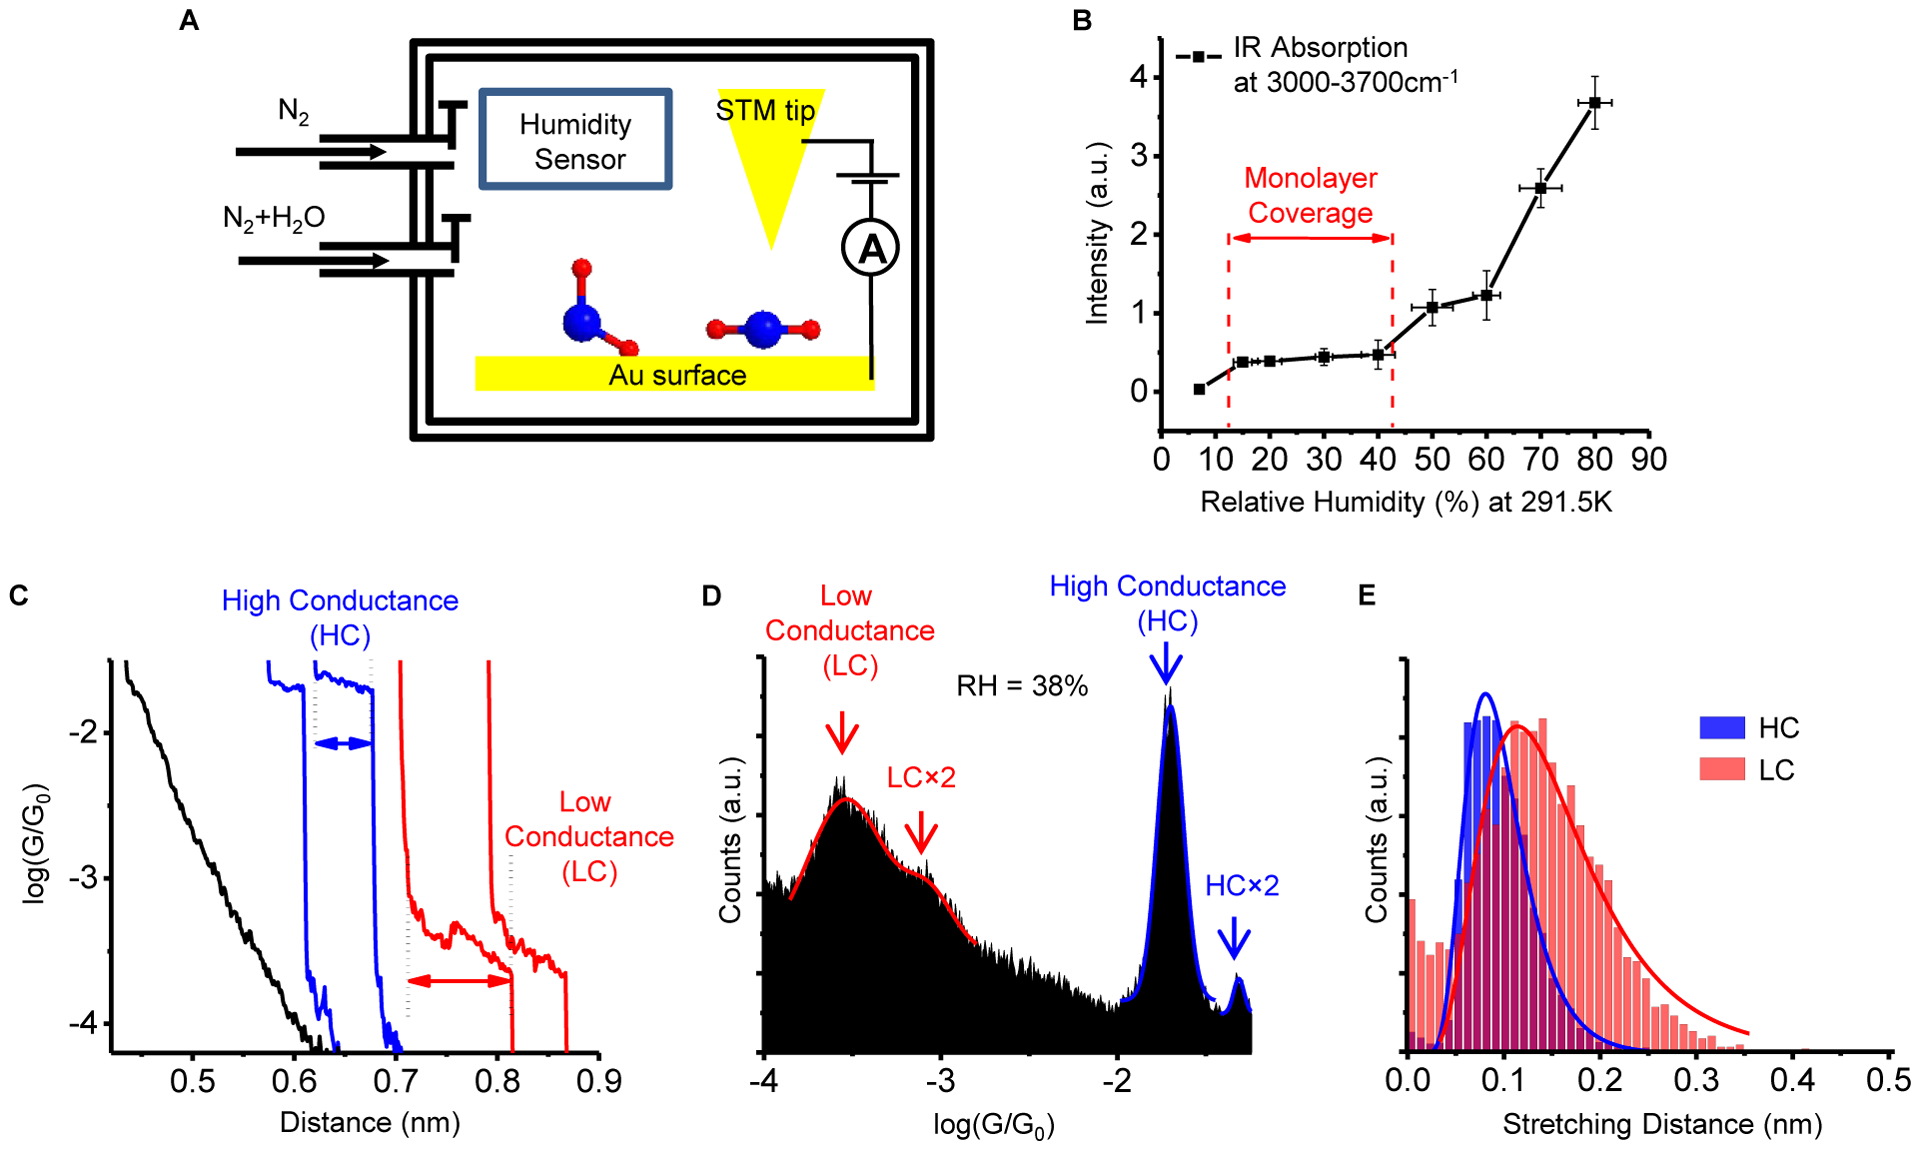
Figure 1. Conductance measurements of water molecular junctions.

(A) Schematic illustration of the experimental setup. A gold STM tip is brought into contact with a water molecule-covered gold substrate and then retracted from the substrate. During this process, a water molecule can bridge between the two electrodes, forming a gold-water-gold molecular junction. (B) PM-RAIRS analysis was performed on the gold surface with controlled relative humidity. Plotting the absorption band intensity in the region of 3000–3700 cm−1 (O-H stretching modes of water) versus the relatively humidity shows a quasi-stable region from ~15% to ~45%, likely due to a monolayer coverage. The error bars in the IR data are the standard deviations of more than 3 sets of experiments. (C) Representative current-distance (I-d) traces during the retraction process of STM tip in panel A show conductance plateaus in a high conductance (HC) state (blue) and a low conductance (LC) state (red). I-d traces without forming a molecular junction between the tip and the substrate show smooth exponential decay (black). (D) A representative conductance histogram with a relative humidity of ~38% constructed from ~4000 I-d traces show a HC peak and a LC peak, peaks at 2× the HC and LC values (HC×2 and LC×2) that originate from two water molecules bridging between the electrodes in parallel. The solid lines are Gaussian fits to the histograms, and the peak positions from the fits are taken as the conductance values. (E) Stretching length histograms of the HC and LC states, where the solid lines are fits with a lognormal distribution. The stretching length is the distance over which a molecular junction can be extended before breakdown (arrows marked in panel C). See also Figure S2, Figure S3 and Figure S4.
